

Lucky Block Price Forecast – Expert Analysis & Trading Tips | Learn 2 Trade – Expert Analysis & Trading Tips | Learn 2 Trade: June 29
The Lucky Block price forecast suggests that buyers’ influence on the market will persist after a sudden surge to $0.0001990.
LBLOCK/USD Long-Term Trend: Bullish (1-Day Chart)
Key Levels:
Supply Zones: $0.0002980, $0.0002740, $0.0001990
Demand Zones: $0.0001880, $0.0001570, $0.0001420
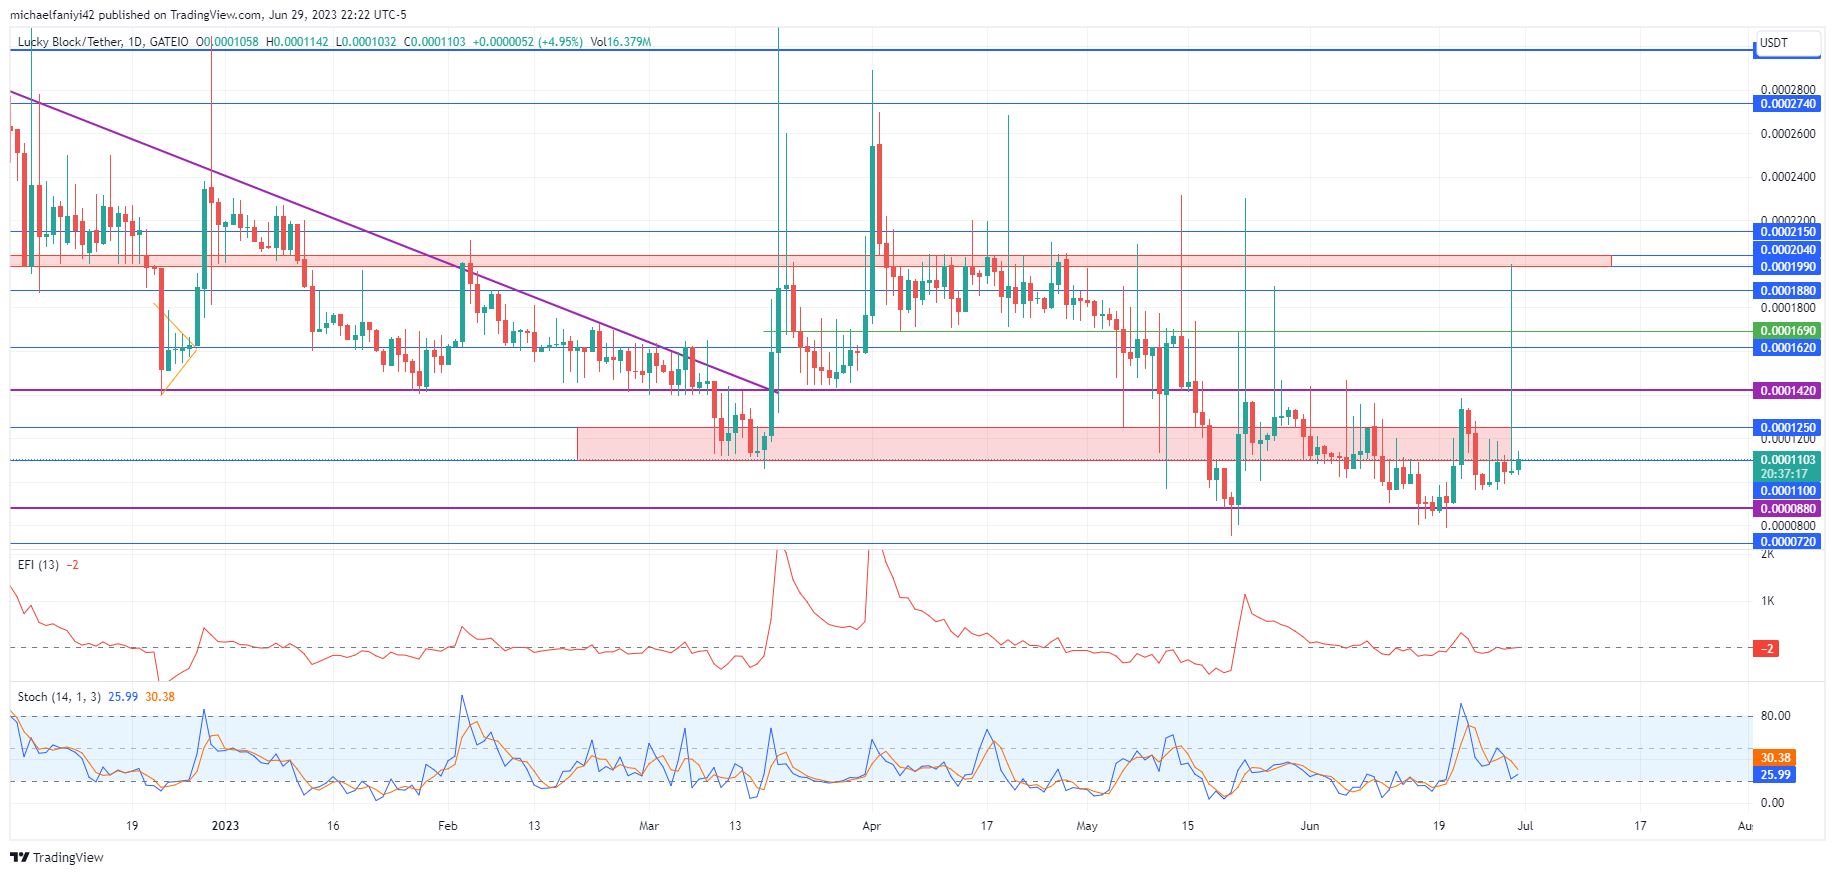
Once again, Lucky Block buyers have demonstrated their intention to drive the market upward. This is evident from a substantial spike, with the candlestick’s shadow reaching the resistance level of $0.0001990. Although the coin retraced, the spike propelled the market above the $0.0001100 resistance level. Buyers are expected to capitalize on this to drive the price higher.
Lucky Block Price Forecast – Expert Analysis & Trading Tips | Learn 2 Trade – Expert Analysis & Trading Tips | Learn 2 Trade: LBLOCK/USD Outlook
The Lucky Block market is ranging between the $0.0001420 and $0.0000880 significant levels after dropping from a failed attempt to bypass the $0.0001990 resistance level.
Within these key levels, the price fluctuations have been random, and bulls seek a way out. Additionally, the $0.0001100 resistance has been obstructing the upward movement.
In response, Lucky Block has now displayed a spike that touched the $0.0001990 major supply line. The EFI (Elders Force Index) powerline has risen above zero, swinging the coin in the buyers’ favor.
LBLOCK/USD Medium-Term Trend: Bullish (4-hour chart)
The Stochastic Oscillator lines on the daily timeframe have risen to scrape the overbought borderline. However, with the retracement in price back below $0.0001250, the lines have now dropped back a little below the middle line. Bulls are expected to rework the market to push above $0.0001420 and towards $0.0001990.

On the 4-hour chart, the EFI power line has risen highly but has a downward bend at its tip in response to the quick retracement of the market back below $0.0001250. There is not much difference in the Stochastic Oscillator across the daily and 4-hour timeframes; its line has dropped slightly below the mid-line.
How To Buy Lucky Block
Note: Learn2.trade is not a financial advisor. Do your research before investing your funds in any financial asset or presented product or event. We are not responsible for your investing results.
- Broker
- Min Deposit
- Score
- Visit Broker

- Award-winning Cryptocurrency trading platform
- $100 minimum deposit,
- FCA & Cysec regulated

- 20% welcome bonus of upto $10,000
- Minimum deposit $100
- Verify your account before the bonus is credited


- Fund Moneta Markets account with a minimum of $250
- Opt in using the form to claim your 50% deposit bonus


