

Lucky Block – Guide, Tips & Insights | Learn 2 Trade Price Forecast – Expert Analysis & Trading Tips | Learn 2 Trade – Expert Analysis & Trading Tips | Learn 2 Trade: July 13
The Lucky Block – Guide, Tips & Insights | Learn 2 Trade price forecast is for the buyers to maintain their upward trajectory, which is expected to help them breach the $0.0001420 resistance level.
LBLOCK/USD Long-Term Trend: Bullish (1-Day Chart)
Key Levels
Supply Zones: $0.0001990, $0.0001420, $0.0001100
Demand Zones: $0.0000880, $0.0000720, $0.0000360
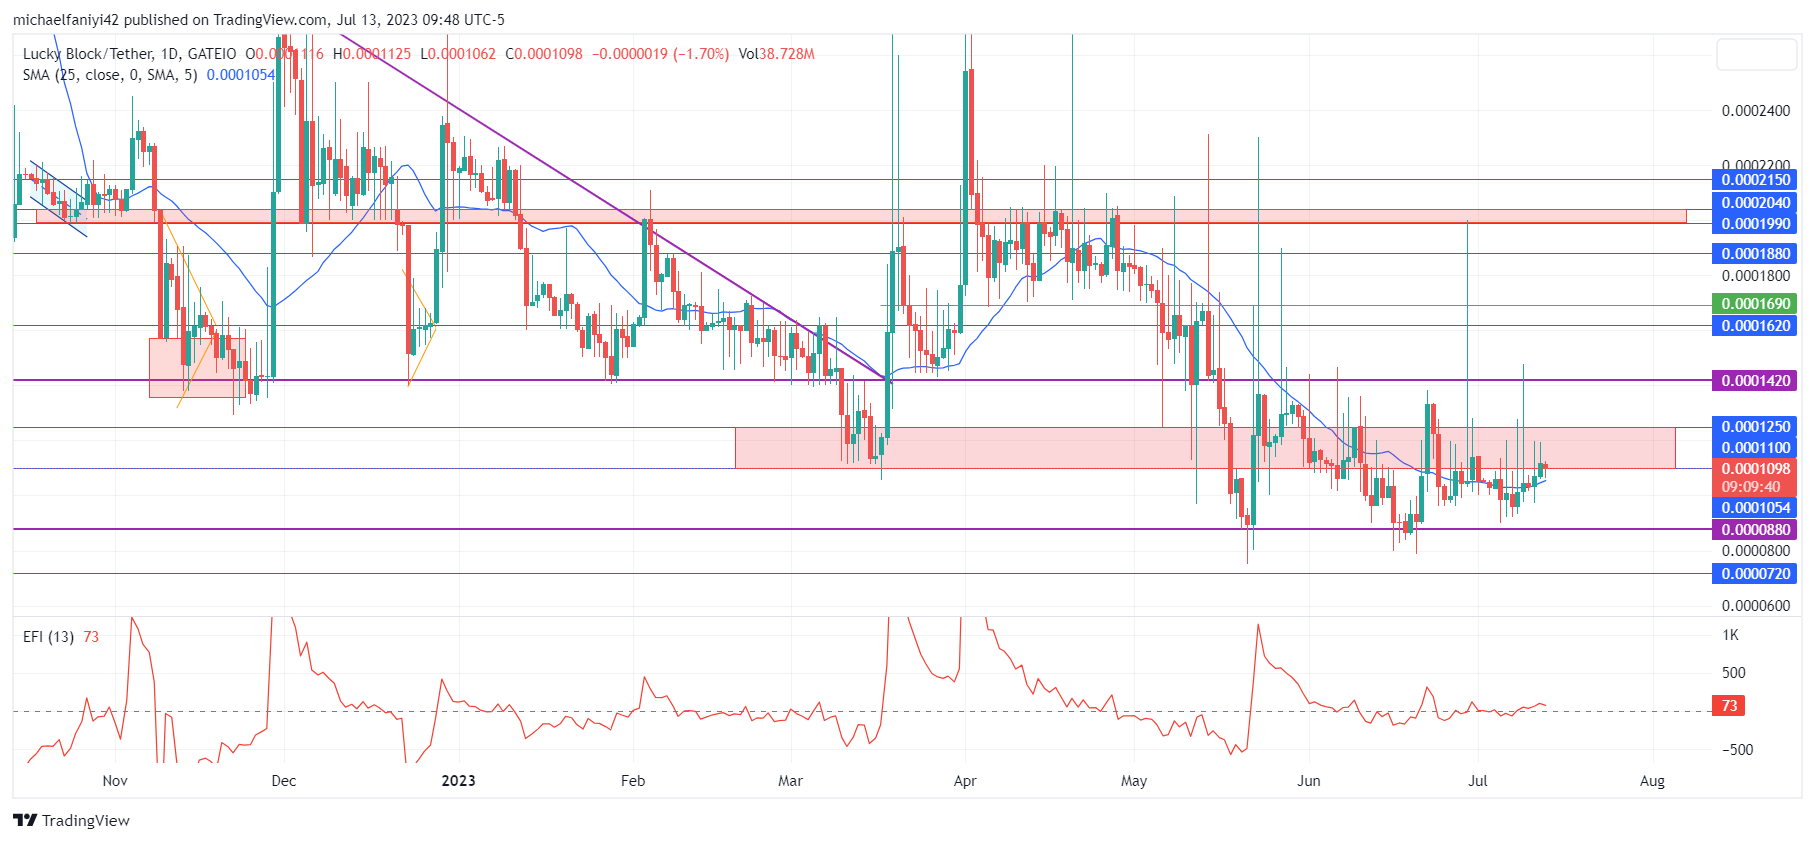
The Lucky Block – Guide, Tips & Insights | Learn 2 Trade market is rising to make another attempt at breaking through the $0.0001420 resistance level, which seals the consolidation. The market rise starts at the $0.0000880 significant support level and is already piercing through the $0.0001100 resistance level with consecutive candlesticks.
Lucky Block – Guide, Tips & Insights | Learn 2 Trade Price Forecast – Expert Analysis & Trading Tips | Learn 2 Trade – Expert Analysis & Trading Tips | Learn 2 Trade: LBLOCK/USD Outlook
LBLOCKUSD buyers are gradually building momentum of the consolidation support level at $0.0000880. The market is rising using consecutive bullish candlesticks.
This is the third time that the coin has attempted to rise off the support level. The earlier attempts ended at $0.0001420 resistance, with the second ending earlier than expected.
After some periods of struggling below $0.0001100, the bulls have been emboldened to push beyond $0.0001100. The MA period 25 (Moving Average) underlines the daily candlesticks.
LBLOCK/USD Medium-Term Trend: Bullish (4-hour chart)
The EFI (Elders Force Index) power line on the daily chart is moving around the zero level. Currently, the line has risen slightly above the zero level as the price keeps rising with bullish candlesticks.

Similar to the daily chart, the MA period 25 is underlining the 4-hour candlesticks as it progresses through the $0.0001100 significant level. The EFI on the 4-hour chart is similarly fluctuating around the zero level at present. There is anticipation that LBLOCK will keep rising till it breaches the $0.0001420 resistance.
How To Buy Lucky Block – Guide, Tips & Insights | Learn 2 Trade
Note: Learn2.trade is not a financial advisor. Do your research before investing your funds in any financial asset or presented product or event. We are not responsible for your investing results.
- Broker
- Min Deposit
- Score
- Visit Broker

- Award-winning Cryptocurrency trading platform
- $100 minimum deposit,
- FCA & Cysec regulated

- 20% welcome bonus of upto $10,000
- Minimum deposit $100
- Verify your account before the bonus is credited


- Fund Moneta Markets account with a minimum of $250
- Opt in using the form to claim your 50% deposit bonus



