

Lucky Block – Guide, Tips & Insights | Learn 2 Trade Market Prediction – Expert Analysis & Trading Tips | Learn 2 Trade: December 29
The Lucky Block – Guide, Tips & Insights | Learn 2 Trade market prediction is that the price will look to push even higher, having broken out of the $0.0001880 resistance level.
LBLOCK/USD Long-Term Trend: Bullish (1-Day Chart)
Key Levels:
Zones of supply: $0002980, $0.0002040, $0.0001880
Zones of Demand: $0.0001570, $0.0001360, $0.0001200
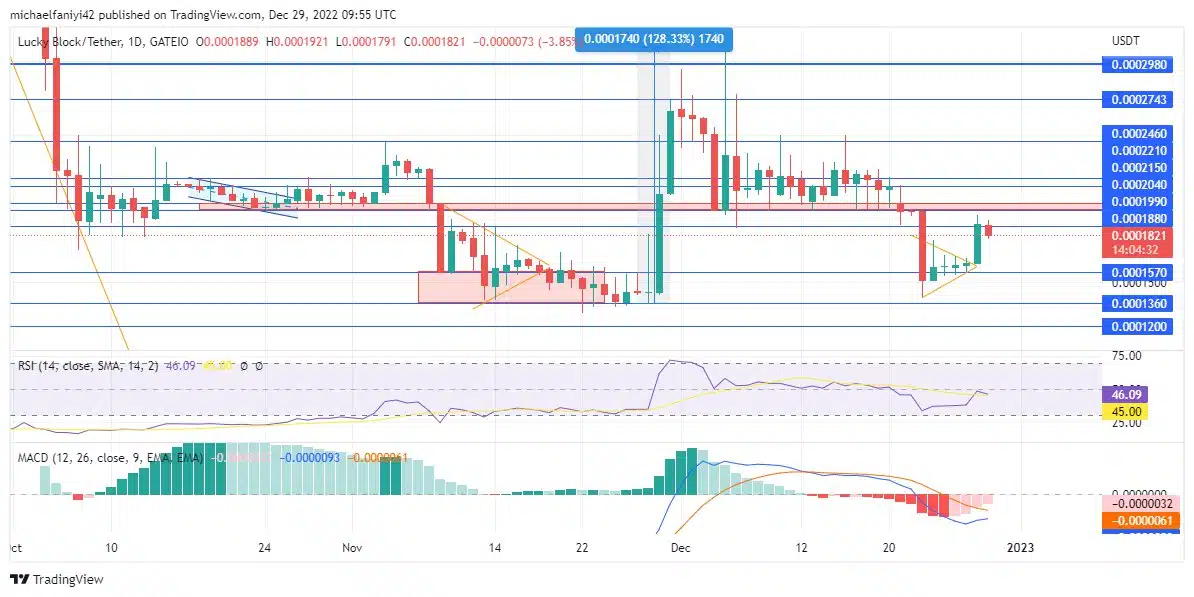
LBLOCKUSD has been trying to strengthen its market to break the $0.0002980 resistance level. The latest move is to bring in more market investors at a lower price. Hence the coin dropped to $0.0001570, where many buyers got in, and now the price is on the rise. Its triangle structure has been broken to the upside, and the market has now risen to $0.0001880. More upward movement is anticipated from here.
Lucky Block – Guide, Tips & Insights | Learn 2 Trade Market Prediction – Expert Analysis & Trading Tips | Learn 2 Trade: LBLOCK/USD Anticipation
LBLOCK has successfully executed a strategy to strengthen its bullish market. This strategy was put in place after the price was finding it increasingly harder to push through to the $0.0002980 resistance level.
The strategy involves the coin dropping to a lower price to accommodate more market investors which will strengthen the market and push it back upward.
The RSI (Relative Strength Index) line, which hitherto was moving laterally, has taken a sharp turn upward towards the middle line in response to the breakout.
LBLOCK/USD Medium-Term Trend: Bullish (4-hour chart)
The MACD (Moving Average Convergence Divergence) chart on the daily time frame is slowly reacting to the breakout of the price. Its lines are about to cross each other upward from a negative value. Nevertheless, on the 4-hour chart, there is a significant change shown on the MACD chart. The lines have crossed and risen significantly above the middle level, accompanied by strong bullish bars.

The RSI line on the 4-hour chart has also had a tremendous rise from the oversold region into the bullish half of the chart. The line has just stopped short at the border of the overbought region as the price pulls back a little. LBLOCKUSD is expected to pierce through to $0.0002040 to complete its recovery before starting another journey to even higher levels.
How To Buy Lucky Block – Guide, Tips & Insights | Learn 2 Trade
Note: Learn2.trade is not a financial advisor. Do your research before investing your funds in any financial asset or presented product or event. We are not responsible for your investing results.
- Broker
- Min Deposit
- Score
- Visit Broker

- Award-winning Cryptocurrency trading platform
- $100 minimum deposit,
- FCA & Cysec regulated

- 20% welcome bonus of upto $10,000
- Minimum deposit $100
- Verify your account before the bonus is credited


- Fund Moneta Markets account with a minimum of $250
- Opt in using the form to claim your 50% deposit bonus


