

Lucky Block Price Forecast – Expert Analysis & Trading Tips | Learn 2 Trade – Expert Analysis & Trading Tips | Learn 2 Trade: May 11
The Lucky Block price forecast is bullish as the larger Moving Averages period eighty-nine and period two hundred are seen to support the ascending market.
LBLOCK/USD Long-Term Trend: Bullish (30-Minute Chart)
Key Levels:
Supply Zones: $0.0013400, $0.0013000, $0.0012400
Demand Zones: $0.0009980, $0.0011000, $0.0011800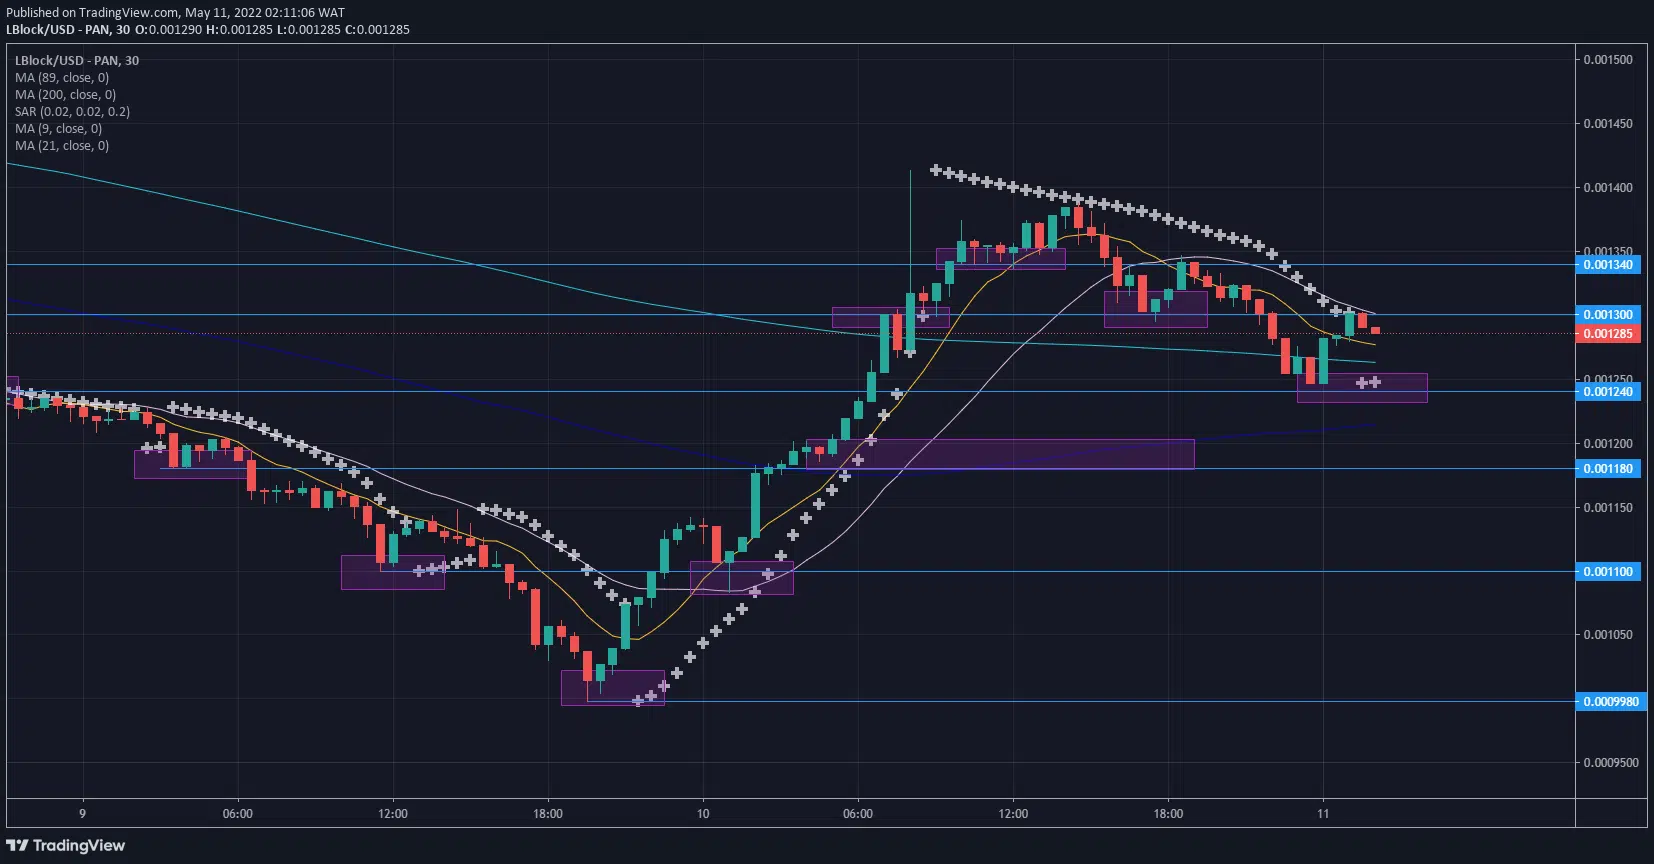
Lucky Block Price Forecast – Expert Analysis & Trading Tips | Learn 2 Trade – Expert Analysis & Trading Tips | Learn 2 Trade: LBLOCK/USD Market Reversal Anticipation
On the 10th of May, the Moving Averages periods nine and twenty-one crossed the higher Moving Averages. At this point, the market was bullish both on the thirty-minute timeframe and the five-minute time frame.
LBlock reached the resistance zone at $0.0013400. As a result, the market reversed its course.
The lower periods of the Moving Averages (period nine and twenty-one) crossed at the resistance zones to show the retracement. The higher periods of the Moving Averages (periods eighty-nine and twenty-one) are still resting beneath the candles to show that the market is still overall bullish.
LBLOCK/USD Medium-Term Trend: Bullish (5-minute chart)
LBlock is currently reacting at the $0.001240 key zone. An order block has formed at the major level, which appears to be pushing the price higher. 
How To Buy Lucky Block
Note: Learn2.trade is not a financial advisor. Do your research before investing your funds in any financial asset or presented product or event. We are not responsible for your investing results.


