

Market Analysis – July 10
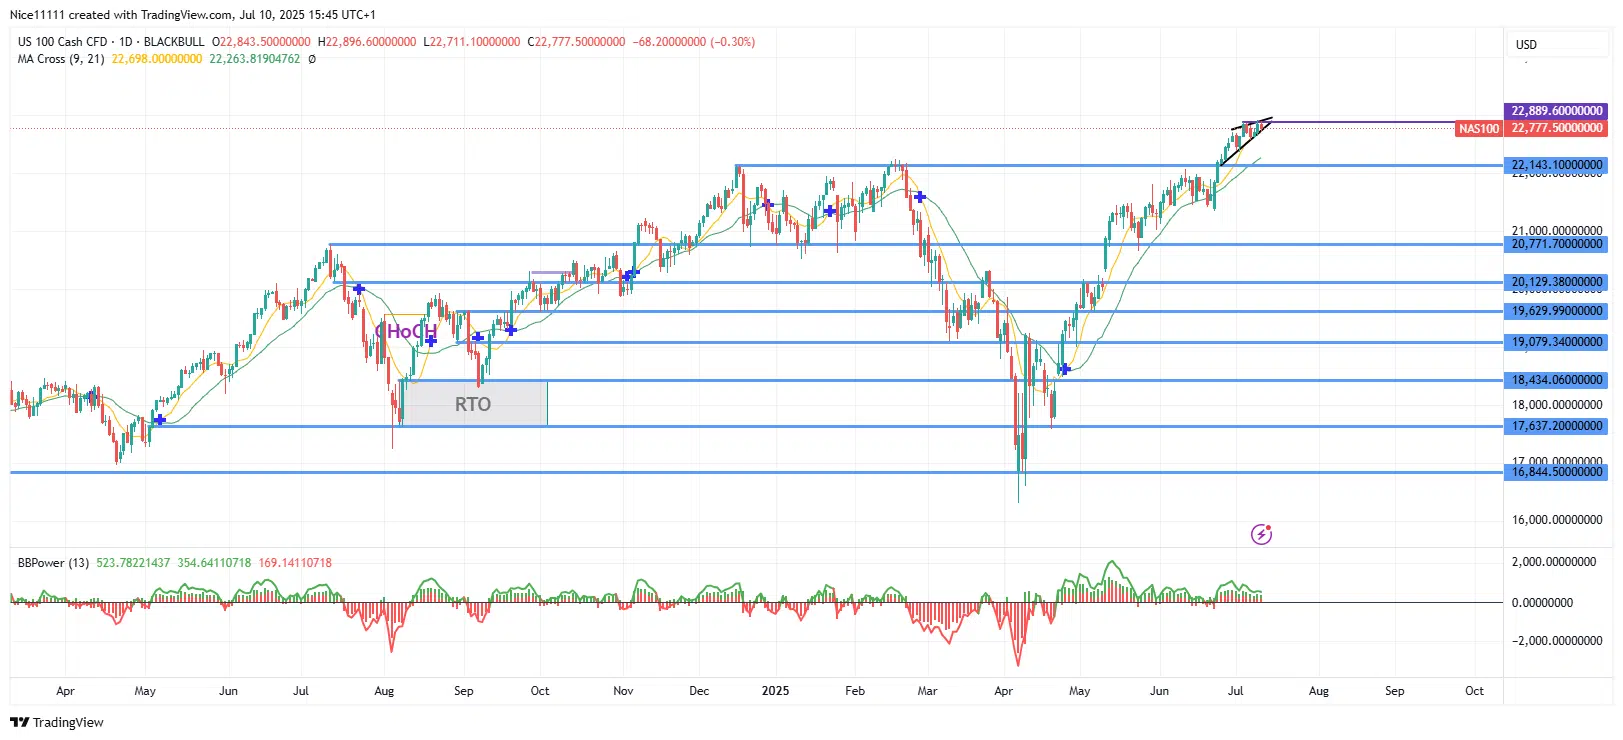
Nasdaq 100 witnessed a decisive bullish breakout in July. Buyers had previously made three separate attempts to surpass the critical resistance level at 22143.0, but each effort initially fell short. However, sustained buying pressure has finally driven the price above this level, indicating the market’s readiness for a new bullish expansion phase.
Nasdaq Key Levels
Supply Levels: 22890.0, 23000.0, 24000.0
Demand Levels: 22771.0, 20129.0, 19079.0
Nasdaq Long-Term Trend: Bullish
The Moving Average string crossover in April initiated a structural shift in price direction. This crossover signaled the start of a sharp bullish rally that quickly approached the former all-time high of 22143.0. Throughout the climb, the 9-period Moving Average consistently acted as dynamic support, strengthening the bullish momentum. Following a test of the resistance zone at 22143.0, the price experienced a brief pullback before finding fresh support on the Moving Averages—propelling a breakout beyond the previous high.
The Elder Ray Bull and Bear Power indicator confirms the prevailing bullish sentiment in the market. The breakout above the key level was forceful enough to leave behind a Fair Value Gap, indicating areas of price imbalance that point to institutional involvement and potential zones for retracement or future support. This development aligns with professional forex signals predicting continued upside potential.

Nasdaq Short-Term Trend: Ranging
Make money without lifting your fingers: Start using a world-class auto trading solution
How To Buy Lucky Block
Note: Learn2.trade is not a financial advisor. Do your research before investing your funds in any financial asset, product, or event. We are not responsible for your investment results.


