Lucky Block Price Forecast – Expert Analysis & Trading Tips | Learn 2 Trade – Expert Analysis & Trading Tips | Learn 2 Trade – August 2
The Lucky Block price forecast is bullish. The market has dipped below the fifty percent level of the Fibonacci scale to provide better opportunities for the bulls.
LBLOCK/USD Long-Term Trend: Bullish (30-Minute Chart)
Key Levels:
Supply Levels: $0.001070, $0.000950.
Demand Levels: $0.000880, $0.000780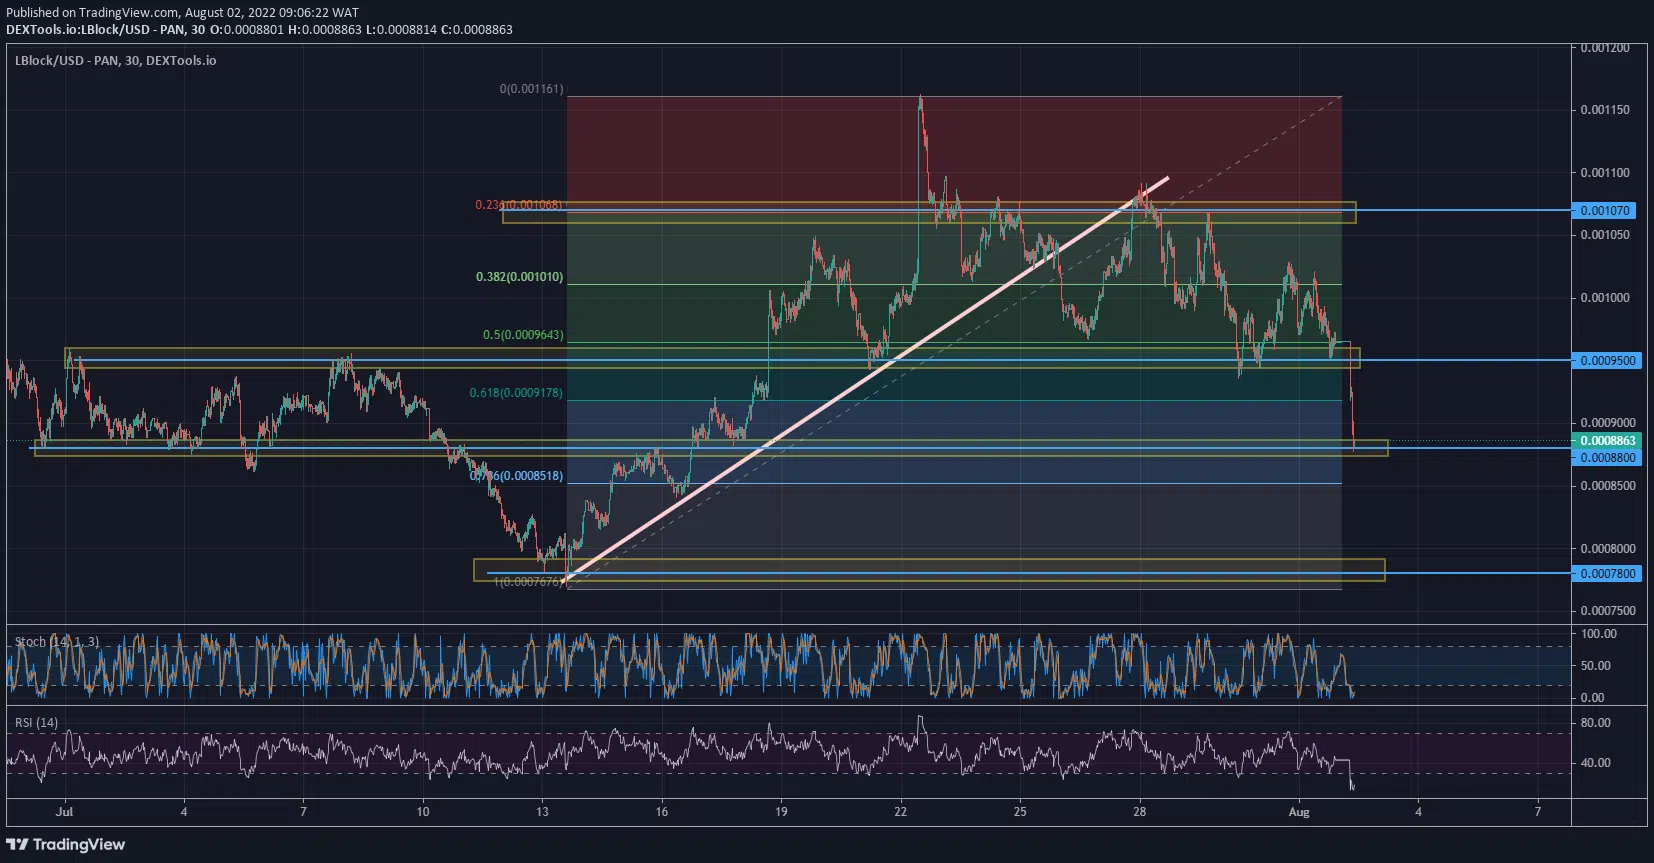
Lucky Block Price Forecast – Expert Analysis & Trading Tips | Learn 2 Trade – Expert Analysis & Trading Tips | Learn 2 Trade: LBLOCK/USD Outlook
LBLOCK market dived after the consolidation to create a directional manipulation. The market started rising rapidly after the bearish motion to $0.000780. The bulls utilized the bearish breakout from $0.000880 to go long at a deeper discount. The market skyrocketed when the Stochastic was in the oversold region.
Higher highs and higher lows formed as the price took off from the demand level. The higher lows aligned neatly along a bullish trend line as the market ascended. The second half of the month was very bullish. The market broke the previous supply level at $0.000950. The market peaked above $0.001070 in July.
There was a bearish market structural shift just below $0.001070. The market entered a correction phase to seek support. The RSI (Relative Strength Index) has dipped into the oversold region. The market has dropped below the midpoint of the bullish range to continue the bullish run from discount levels. The Stochastic is also in the oversold region like the RSI. This is expected to get the bulls prepared to strike.
Medium-Term Trend: Bullish (5-minute chart)
LBLOCK/USD is also oversold on the 5-minute chart, as it is on the 30-minute time frame. The Stochastic and the RSI indicators are in the oversold region.
You can purchase Lucky Block here. Buy LBLOCK
Note: Learn2.trade is not a financial advisor. Do your research before investing your funds in any financial asset or presented product or event. We are not responsible for your investing results
- Broker
- Min Deposit
- Score
- Visit Broker

- Award-winning Cryptocurrency trading platform
- $100 minimum deposit,
- FCA & Cysec regulated

- 20% welcome bonus of upto $10,000
- Minimum deposit $100
- Verify your account before the bonus is credited


- Fund Moneta Markets account with a minimum of $250
- Opt in using the form to claim your 50% deposit bonus