

Lucky Block Price Forecast – Expert Analysis & Trading Tips | Learn 2 Trade – Expert Analysis & Trading Tips | Learn 2 Trade: May 19
The Lucky Block price forecast is for the market to continue its uptrend with the aid of the bullish trend line.
LBLOCK/USD Long-Term Trend: Bullish (30-Minute Chart)
Key Levels:
Supply Zones: $0.001470, $0.0013500, $0.0011700, $0.0011100
Demand Zones: $0.0008730, $0.0009230 $0.0010700, $0.0012200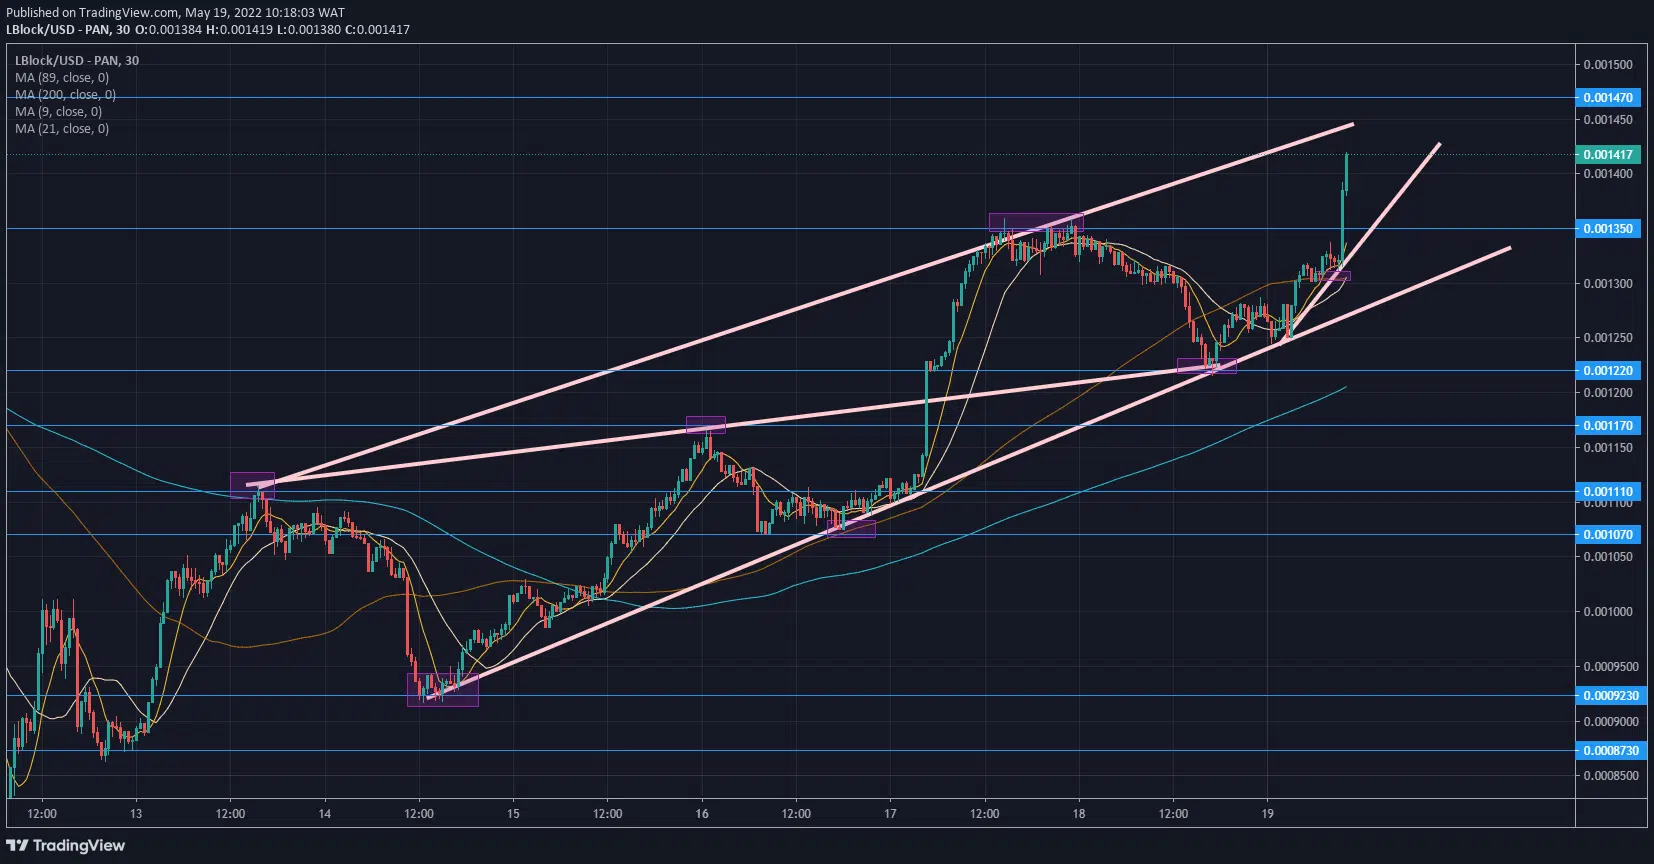
Lucky Block Price Forecast – Expert Analysis & Trading Tips | Learn 2 Trade – Expert Analysis & Trading Tips | Learn 2 Trade: LBLOCK/USD Market Outlook
The market is currently ascending through a parallel channel. The supporting trend line of the channel has been tested three times. The test of the bullish trend line has caused massive displacements to break resistance levels on Lucky Block.
The Moving Averages period two hundred and eighty-nine signified the market had turned bullish on the 15th of May. The bodies of the 30-minute candles lay above the Moving Average.
The other Moving Averages periods, periods nine and twenty-one, show the continuous bullish reversal at the support trend line. The Moving Averages (period nine and twenty-one) crossed on the 14th and 16th of May to show the continuity of the uptrend. The Moving Averages have also crossed today after the strike of the bullish trend line.
LBLOCK/USD Medium-Term Trend: Bullish (5-minute chart)
The 5-minute chart shows the displacement which was prompted as a result of the test in the bullish confluence zone. The confluence was formed by the cross of the trend lines, which formed the ascending triangle. A double bottom reversal pattern was formed at the confluence zone. This prompted the rapid pumping of the Lucky Block price. 
How To Buy Lucky Block
Note: Learn2.trade is not a financial advisor. Do your research before investing your funds in any financial asset or presented product or event. We are not responsible for your investing results.


