
Market Analysis – January 13
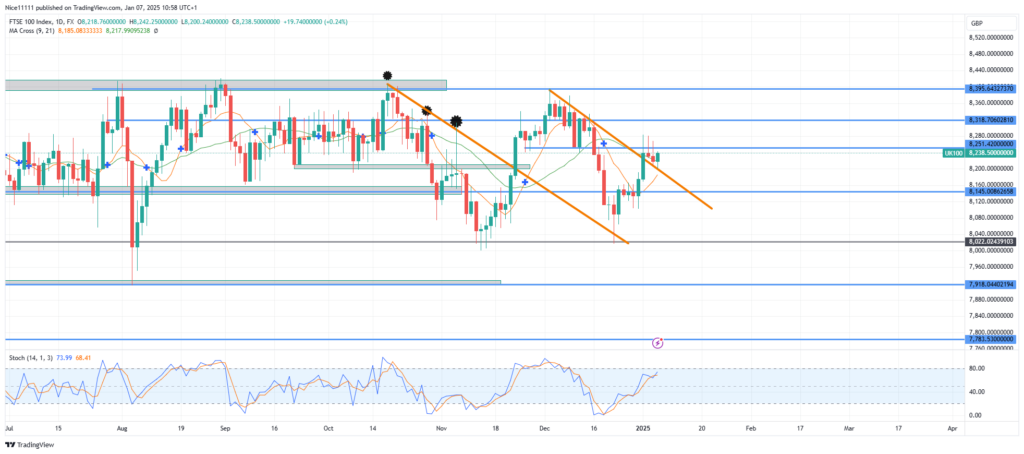
The FTSE 100 has shown increased dynamism as the market range widens on the daily chart. Support at 8022.0 and resistance at 8396.0 have demonstrated remarkable sensitivity, leading to reversals with each test. This behavior creates opportunities for trend-based trading on lower timeframes.
FTSE100 Key Levels
Resistance Levels: $8372.0, $8474.0
Support Levels: $8113.0, $7216.0

FTSE 100 Long-Term Trend: Ranging
The ongoing consolidation has extended from 8145.0 to a lower demand level at 8022.0, offering more room for price movement within the range.
Since the start of this consolidation phase, the 8022.0 demand level has been tested three times. During the first two tests, in August and November, the Stochastic indicator signaled oversold conditions. These signals spurred rapid price increases back to the range’s resistance ceiling at 8395.0. The inclusion of forex signals in market discussions has further enriched trading perspectives during these movements.

FTSE 100 Short-Term Trend: Bullish
Make money without lifting your fingers: Start using a world-class auto trading solution
How To Buy Lucky Block
Note: Learn2.trade is not a financial advisor. Do your research before investing your funds in any financial asset, product, or event. We are not responsible for your investment results.


