
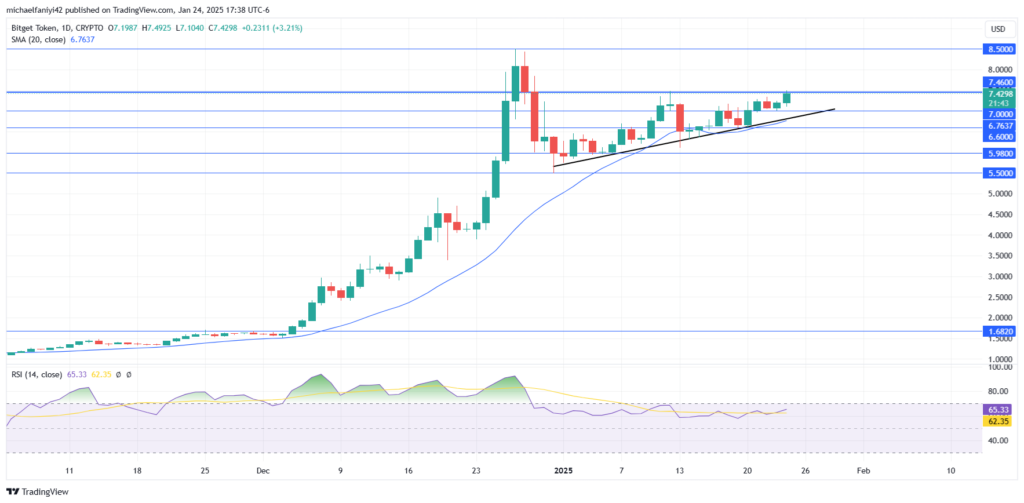
Bitget Token Price Forecast: January 23
The Bitget token price forecast suggests the coin is gearing up to challenge the critical resistance level at $7.460 after successfully surpassing the $7.000 key level.
Bitget Token Long-Term Trend: Bullish (1-Day Chart)
Key Levels:
Resistance Levels: $7.460, $8.500
Support Levels: $7.000, $6.600  The Bitget token continues its steady ascent through key levels. Since December 2024, the market has exhibited a robust bullish trend, achieving a price increase of over 400% into the new year and marking a significant all-time high at $8.500. A subsequent retracement lowered the price to $5.500, but the bulls have regained control, driving the token back upward toward the all-time high.
Bitget Token Price Forecast: BGB/USD Outlook
The token remains firmly in a bullish phase, making consistent upward progress. The immediate goal is to recover and push the price back to the all-time high of $8.500.
The $7.460 resistance level is critical, as the coin has previously been rejected at this point. Surpassing it would further bolster bullish momentum and increase the likelihood of retesting $8.500.
On the daily chart, the 20-period Moving Average (MA) aligns well with the uptrend line, providing solid support for continued price growth. The Relative Strength Index (RSI) confirms that the .
Bitget Token Medium-Term Trend: Bullish (4-Hour Chart)
Similar to the daily chart, the RSI line on the 4-hour chart is maintaining a position above the 50 mark, ensuring the market remains bullish without approaching overbought conditions. This helps to mitigate the risk of exhaustion among buyers and reduces the likelihood of a sudden price drop unless there is significant bearish pressure. 
Make money without lifting your fingers: Start using a world-class auto trading solution
How To Buy Lucky Block
Note: Learn2.trade is not a financial advisor. Do your research before investing your funds in any financial asset, product, or event. We are not responsible for your investment results.


