
Key Highlights
Litecoin hits the overhead resistance at $76
The altcoin risks decline to $60 low
Litecoin (LTC) Current Statistics
The current price: $69.53
Market Capitalization: $5,215,827,664.01
Trading Volume: $352,570,585.50
Major supply zones: $100, $120, $140
Major demand zones: $80, $60, $40
Litecoin (LTC) Price Analysis October 23, 2024
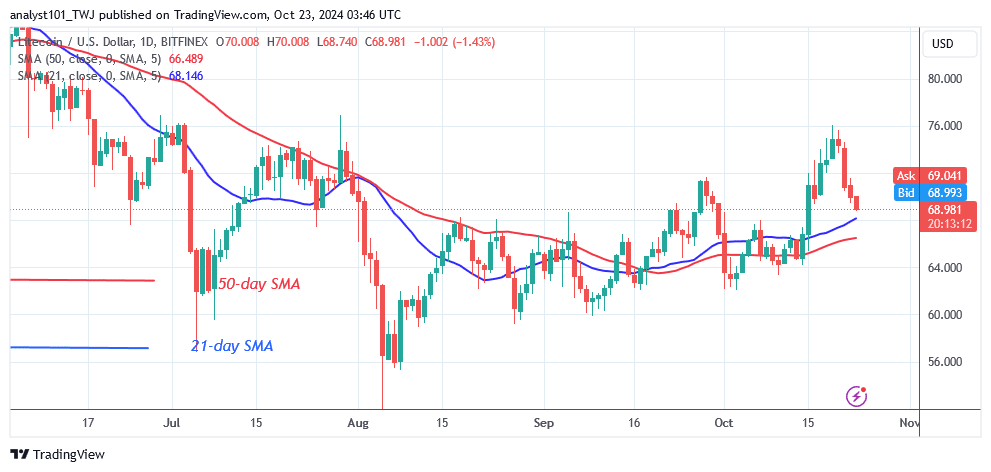
The price of Litecoin (LTC) has been declining since it was rejected on October 20 at the $76 high. In the previous price action, Litecoin rallied to $76 on October 19. On the upside, buyers failed to sustain the bullish momentum above the overhead resistance at $76. This is the third time, the crypto asset will be facing stiff rejection at the recent high.
Litecoin (LTC) Technical Indicators Reading
LTC’s price is still above the moving average lines after its decline. The altcoin will increase if it retraces and finds support above the moving average lines. In prior price movement, the altcoin has fallen below the moving averages. The moving average lines were horizontal since the price levels varied from $60 to $76.
What Is the Next Move for Litecoin
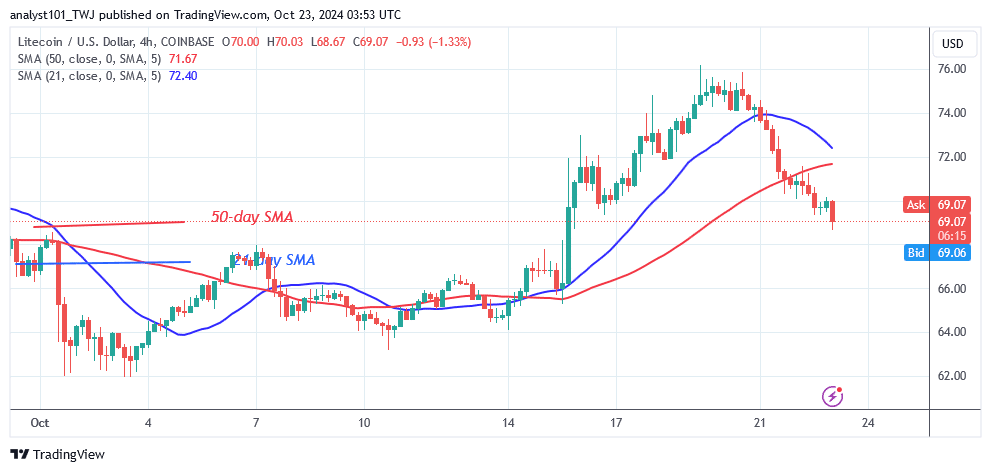
The 4-hour chart shows Litecoin in decline as it confronts rejection at the $76 high. The cryptocurrency price has gone below the moving average lines, reaching a low of $69.11. However, the slide is projected to continue until the next support at $64. Litecoin will revert if it eventually falls above the critical support of $60. Meanwhile, the crypto signal remains unfavorable as the altcoin continues to drop.
Make money without lifting your fingers: Start using a world-class auto trading solution.
NOTE: Learn2.Trade is not a financial advisor. Do your research before investing your funds in any financial asset or presented product or event. We are not responsible for your investing results.

