
Market – May 19
Gold price ascent took off in February. The spread of the Williams Alligator strings revealed a transformation from a long-term consolidation to an uptrend. The price soared till the supply level of 2414.0 was reached. Gold prices crashed upon reaching the resistance level. Bulls have reorganized to enforce a breakout above the resistance zone.
Market Analysis – May 19
Demand Levels – 2320.0, 2285.0 2140.0
Supply Levels – 2500.0, 2600.0, 2700.0
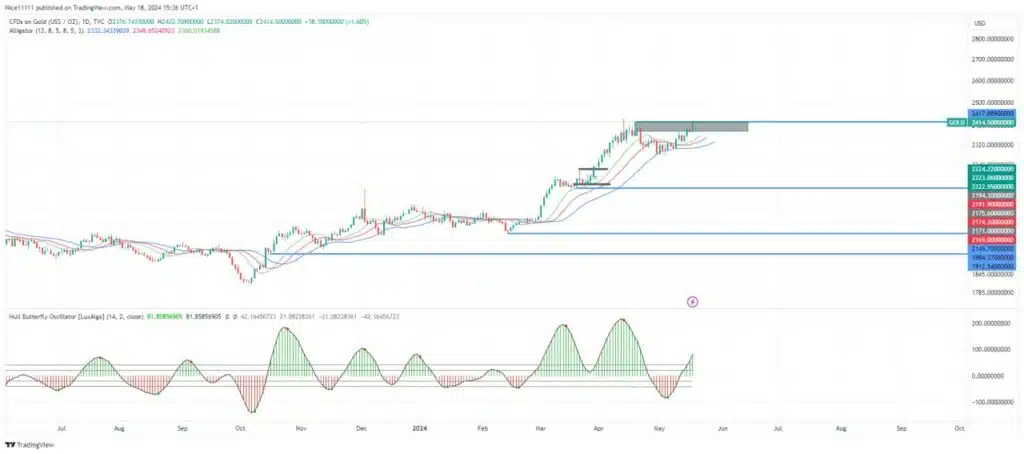
Gold Long-term trend: Bullish
Gold has just completed a major pullback on its bullish trend. The bulls were exhausted after a steady ascent from 2140.0. The Hull Butterfly Indicator signaled a decrease in bullish momentum with the reduced size of the green bars. In May the indicator read negative to show a downward turn in the price.
The price descent halted after the daily candles rested on the Williams Alligator. The current distinction of the daily candles above the Williams Alligator reveals a resumption of the bullish trend.
Gold Short-term trend: Bullish

The shift in market structure that led to the resumption of the price ascent is clear in the lower timeframe. Using top-down analysis by observing multiple timeframes helps determine direction and reversals. The price is expected to rise to the next significant level of 2500.0
You can purchase Lucky Block here. Buy LBLOCK
Note: Learn2.trade is not a financial advisor. Do your research before investing your funds in any financial asset or presented product or event. We are not responsible for your investing results.


