Ethereum (ETH) Current Statistics
The current price: $2,621.21
Market Capitalization: $316,746,483,556.76
Trading Volume: $23,013,793,422.96
Major supply zones: $3,500, $4,000, $4,500
Major demand zones: $2,500, $2,000, $1,500
Ethereum (ETH) Price Analysis February 18, 2025
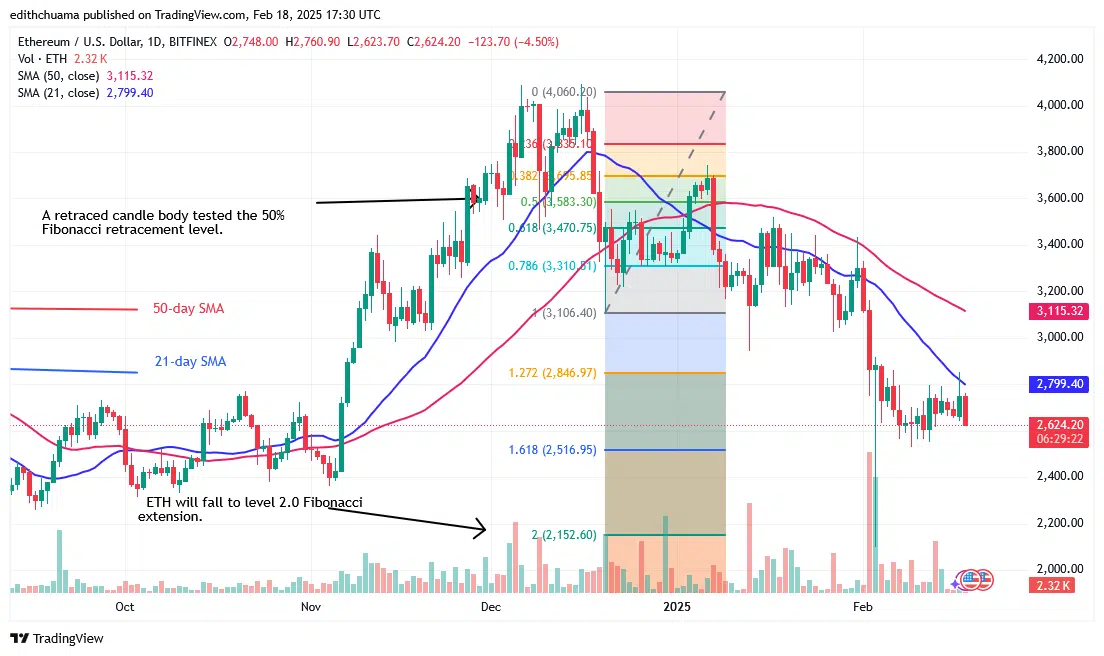
Ethereum (ETH) has been trading below the 21-day SMA barrier as traders become uncertain. The current volatility stemmed from purchasers’ inability to keep the price above the 21-day SMA. On February 17, the positive momentum was resisted by the 21-day SMA, resulting in a decline. On the downside, if the bear breaks below the present support of $2,500, Ether would fall below the previous low of $2,100.
ETH Technical Indicators Reading
The continuing decrease is indicated by the 50-day and 21-day SMAs, which slope downward. Ether is still trading above $2,500, and the selling pressure has decreased. For the last two weeks, the 4-hour chart’s moving average lines have been horizontal.
Conclusion
Ethereum is in a sideways move as traders become uncertain. Buyers have made a serious effort to reestablish the positive trend as shown by the Doji candlestick wicks imply. The price movement has remained restricted due to the presence of Doji candlesticks. Traders are undecided about the direction of the market.

Make money without lifting your fingers: Start using a world-class auto trading solution.
Note: Learn2.Trade is not a financial advisor. Do your research before investing your funds in any financial asset or presented product or event. We are not responsible for your results.