

Buyers are ruling BNB world
BNBUSD Price Analysis: 21 March
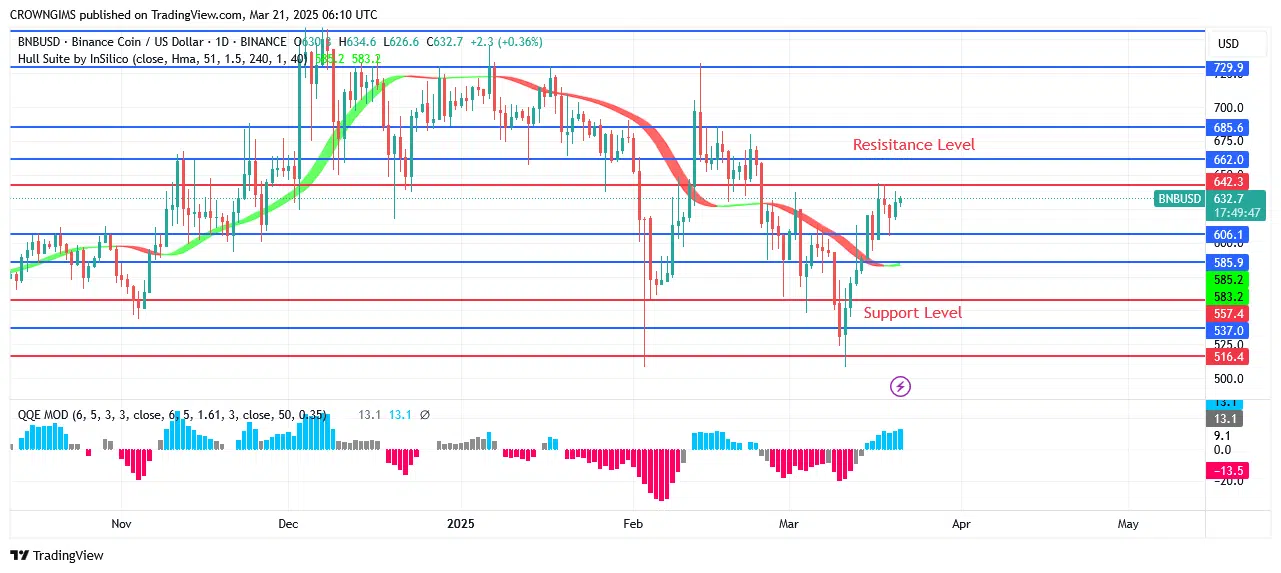
Buyers may be able to push the price to test the $662.0 and $685.0 resistance levels if they can hold onto the $606.1support level and break above the $642.3 resistance level. BNB should go for the prior lows of $585.9 and $557.7 if it can overcome the critical $606.1 barrier.
Key levels:
Supply levels: $642.3, $662.0, $685.0
Demand levels: $606.1, $585.9, $557.7
BNBUSD Long-term Trend: Bullish
The daily chart for the BNBUSD is bullish. On December 9, the cryptocurrency’s price continued to decline, going from $729.9 to $557.7. The bears broke the mentioned barrier as their power grew, despite some pushback. Selling dominates the market, as evidenced by BNB’s recent plunge below $585.9. There were indications of a positive reversal at the anticipated support level. In line with the inclining trend, the price’s latest flip at $557.7 suggests that buyers would accept a higher offer. After retesting at its previous low of $557.7, the price increase. Right now, it costs about $642.3
BNBUSD medium-term Trend: Bullish
Over the next four hours, the coin’s favorable impacts could raise the price of BNBUSD. The BNB began to climb after testing at $585.9. On February 3, we discovered that the total amount paid was $729.0. Because of the bulls’ fervor, the price flipped above the target level. Yesterday, $606.1 was the lowest price. The price is approaching $642.3 today.

Start using a world-class auto trading solution
You can purchase Lucky Block here. Buy LBLOCK


