

USDCHF market may be under buyers soon
USDCHF Price Analysis – 28 March
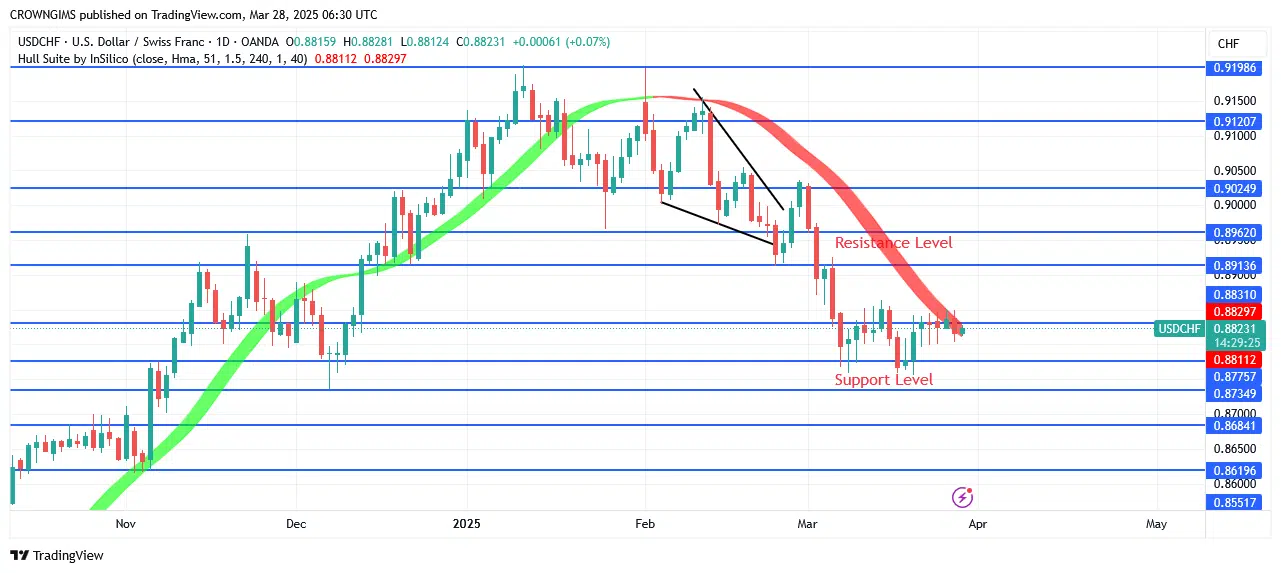
USDCHF can move above $0.90 and get closer to the $0.91 hedging levels if the buying momentum can hold above the $0.89 resistance position. However, if sellers put in enough effort to push the price from the $0.88 to the $0.87 level, merchandisers can lower the price below $0.86.
Key Levels:
Resistance levels: $0.89, $0.90, $0.91
Support levels: $0.88, $0.87, $0.86
USDCHF Long-term trend: Bearish
Over the previous week, the USDCHF chart has been heading lower. Since the price originally surfaced at $0.91 three weeks ago, clients have benefited from the robust USDCHF market. The USDCHF market has been controlled by sellers as of February 25. A few days ago, the value of the two currencies was $0.89. At the first recommended level, a bearish engulfing candle pattern was visible. After that, the price started to drop by more than $0.87. The bearish harami candle pattern was seen to emerge at the resistance level that was previously mentioned. The current goal price is $0.89.
USDCHF Medium-term Trend: Bullish
The USDCHF has a distinctly favorable medium-term outlook. A double bottom candle formation close to the $0.87 barrier level had caused a bullish reversal in the currency pair a few days earlier. When an inner bar candle pattern emerged on March 25, the price made a successful attempt to break up at $0.88. The price began to increase in the direction of the north. Right now, the price is about $0.89. The price may rise to $0.90 if bulls are successful in breaking through the aforementioned barrier.

A bull market is indicated when the currency pair rises above the Hull Suite signal. Offering anything for purchase is advised if the QQE MOD is higher than zero.
Start using a world-class auto trading solution
You can purchase Lucky Block here. Buy LBLOCK


