

UMA’s price action seems to have shaken off bearish pressure as its price pumped back upwards as soon as the market touched the $4.067 mark. This saw the token’s price rebound off a technical support level at the $4.000 mark. Let’s try to see what’s in it for traders.
UMA Statistics:
Current Universal Market Access Value: $4.681
UMA Market Cap: $367,043,395
Universal Market Access Circulating Supply: 78,293,083 UMA
UMA Total Supply: 118,024,168 UMA
UMA CoinMarketCap Rank: 154
Key Price Levels:
Resistance: $4.681, $5.000, and $5.500
Support: $4.182, $3.681, and $3.181
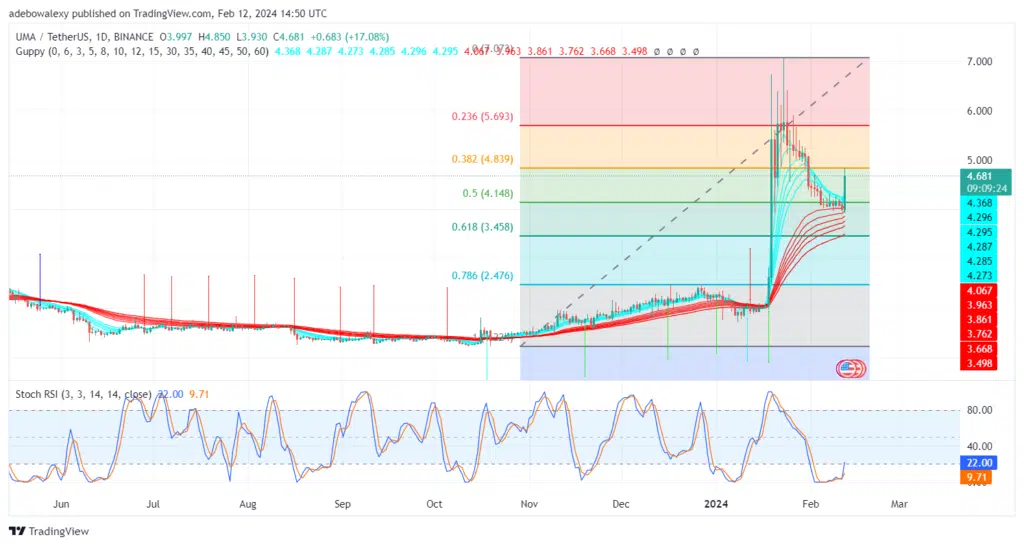
Universal Market Access Witnesses a Significant Re-Entry of Buyers at the $4.000 Mark
The UMA market over a daily time frame has seen a significant price increase. As a result, price action broke through the resistance created by Fibonacci Retracement Level 50. Also, in the ongoing session, price action seems to have faced a rejection off the $4.839 price mark.
However, this was a moderate rejection, and as a result, the Stochastic Relative Strength Index (SRSI) indicator line maintains an upside bearing following the last crossover that it delivered in the oversold region. This suggests that upside forces are still of significant strength, and prices may extend upwards.

UMA Downward Rejection Remains Weak
Even on a 4-hour time frame in the Universal Market Access market, downward forces have a weak initial stand. This is because the last price candle on the chart reveals that downward forces are having a difficult time making progress.
Also, price action remains at some distance above the GMMA lines. Likewise, the SRSI indicator line has a sharp upside trajectory still, despite the rejection being faced in this market. As a result, all technical indications still favor bullish crypto signals in this market. Consequently, traders can maintain focus on the $5.000 mark.


