
Sellers’ momentum may increase further
TRON Price Analysis – 24 July
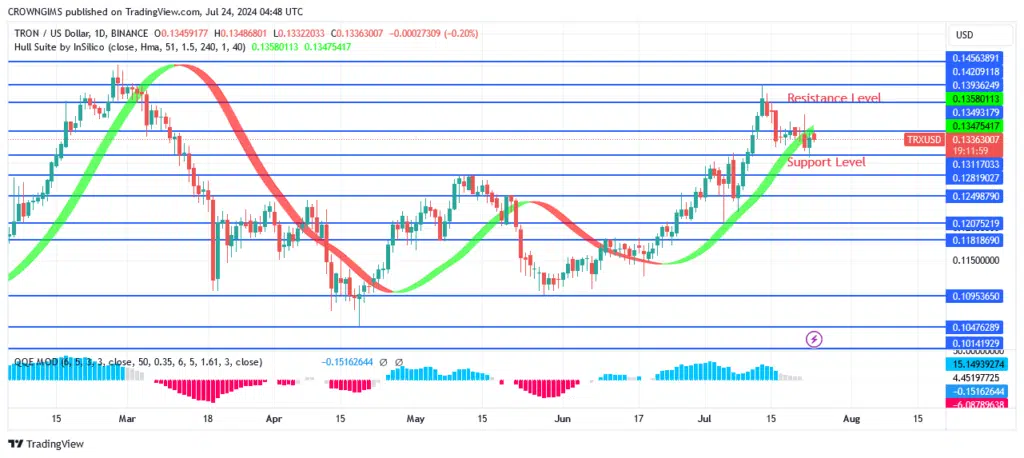
The $0.139 and $0.142 barriers may be overcome by the price of TRON if the purchasing trend stays above $0.134. If the price keeps falling below $0.131, it may cross $0.128 and $0.125.
Key Levels:
Resistance levels: $0.134, $0.139, $0.142
Support levels: $0.131, $0.128, $0.125
TRX/USD Long-term Trend: Bullish
The TRON daily chart is becoming bigger. The coin’s price finally broke over $0.125 on April 19 following a protracted fall. At $0.109, buyers were able to hold a steady line. For TRON, the previously mentioned support barrier turned out to be impenetrable. The cost began to increase. Over the previous two weeks, the purchasing pressure above the $0.131 and $0.134 levels has varied considerably. Resistance level $0.142 has already been put to the test. There may be less purchases done this week than $0.131.
TRX/USD Medium-term Trend: Bearish
The first four hours of the TRON picture are bearish. TRON is currently trading below $0.134, which has the bears just as angry as they were earlier. It fell steadily for approximately a week before breaking through the $0.134 and $0.139 support levels. Sellers defend the level as the price breaks through the prior barrier and approaches the $0.131 support level. If the currency closes below the $0.131 mark, bears might attempt to push it lower.

TRON is now less expensive than the Hull Suite. Moreover, the color red denotes a sell when the QQE MOD falls below the zero level.
Start using a world-class auto trading solution
You can purchase crypto coins here: Buy LBLOCK


