

Polkadot (DOT) Price Long-term Trend: Ranging
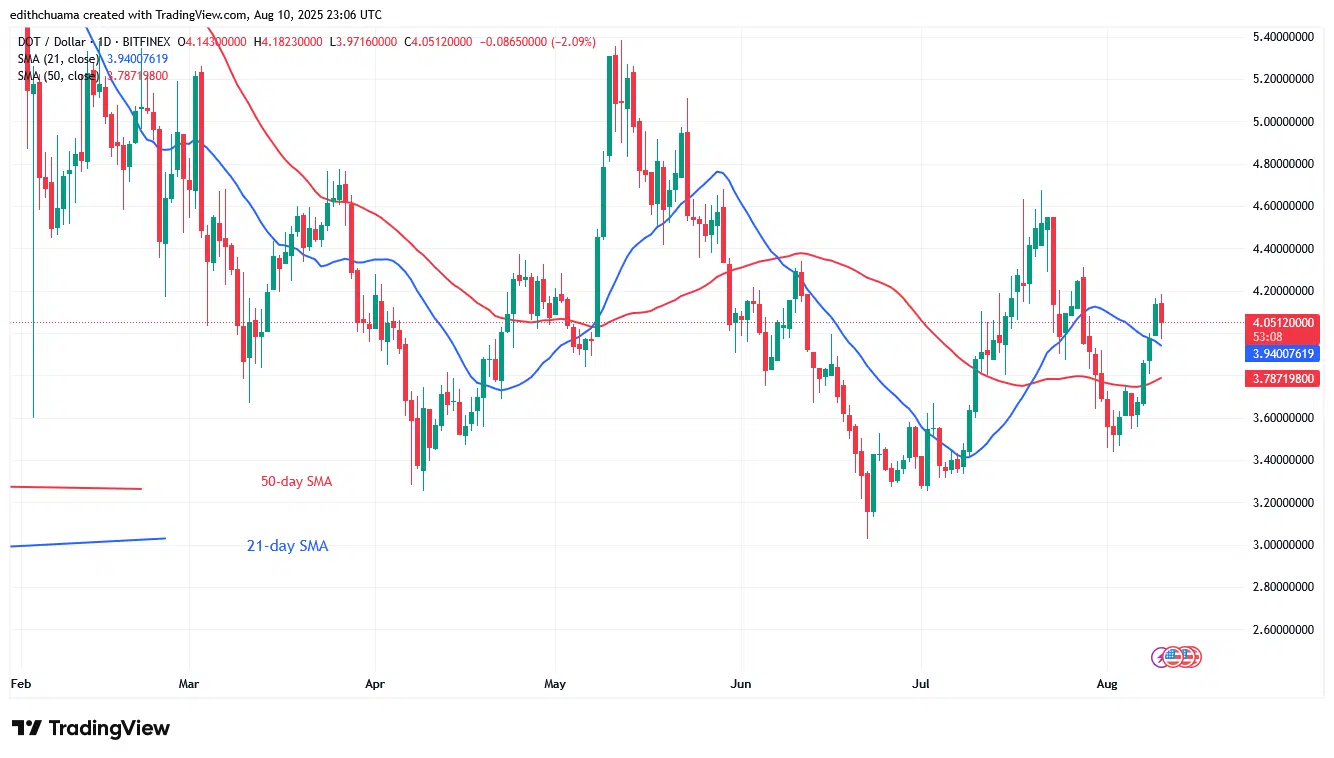
The price of Polkadot (DOT) rises above the moving average lines but confronts the $4.20 hurdle. The cryptocurrency is now trading in a range of $3.00 to $4.20. Today, the upward movement meets initial resistance at $4.20 as it moves above the 21-day SMA support. If the 21-day SMA support holds, the altcoin will continue to advance, reaching a high of $4.50.
Technical indicators:
Key Resistance Levels: $10, $12, $14
Key Support Levels: $5, $3, $1
Polkadot Indicator Analysis
The price of the cryptocurrency has retraced over the 21-day SMA support, indicating more upward momentum. Price bars above the moving average lines are seen on both charts, suggesting that bullish momentum has returned. A bullish trend is shown by the 21-day SMA being higher than the 50-day SMA.
General Outlook for Polkadot (DOT)
Polkadot price is above the moving average lines but confronts the $4.20 hurdle. On the 4-hour chart, the DOT price is rising towards the $4.20 resistance level, which is expected to be breached for the second time. On August 10, the altcoin was pushed back after failing to break the $4.20 resistance level.
If the current hurdle is overcome, the DOT price will increase to $4.50 to $5.35. The DOT price will return to $3.00 to $4.20 if it drops below its most recent peak.

Make money without lifting your fingers: Start using a world-class auto trading solution.
Note: Learn2.Trade is not a financial advisor. Do your research before investing your funds in any financial asset, product, or event. We are not responsible for your investment.


