

Polkadot (DOT) Price Long-term Trend: Bearish
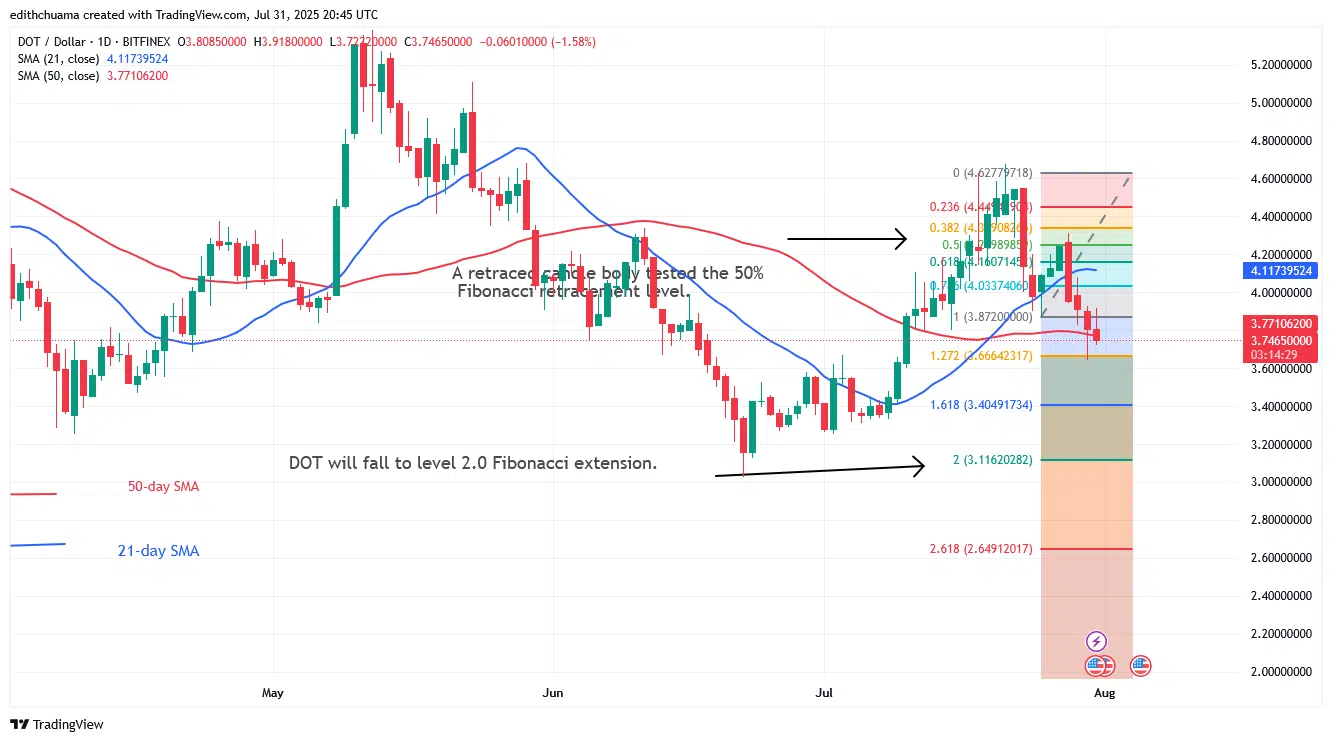
Polkadot’s (DOT) price is falling after reaching a high of $4.67 as it continues to tumble to $3.11. The bearish momentum dropped below the moving average lines. On the downside, the price indication for the cryptocurrency has revealed a further decrease. On July 25, a retraced candle body retested the 50% Fibonacci threshold.
Technical indicators:
Key Resistance Levels: $10, $12, $14
Key Support Levels: $5, $3, $1
Polkadot Indicator Analysis
The negative trend has broken below the moving average lines, implying a further decline to the downside. The price bars are below the downward-sloping moving average lines. Polkadot will return to the former low price level.
General Outlook for Polkadot (DOT)
Polkadot has hit a low of $3.75 and may continue to tumble to $3.11. On the 4-hour chart, a long candlestick tail broke below the $3.70 support and then pulled back. The DOT price is currently trading above the $3.70 support and below the moving average lines. The crypto signal remains negative, as the altcoin enters the bearish trend zone.

Make money without lifting your fingers: Start using a world-class auto trading solution.
Note: Learn2.Trade is not a financial advisor. Do your research before investing your funds in any financial asset, product, or event. We are not responsible for your investment.


