
Lucky Block Price Forecast – Expert Analysis & Trading Tips | Learn 2 Trade – Expert Analysis & Trading Tips | Learn 2 Trade – October 1
The Lucky Block price forecast indicates that buyers have regained momentum, pushing the price toward the significant $0.00002600 level after a brief dip to $0.00002300.
LBLOCKUSD Long Term Trend: Bullish (1-Day Chart)
Key Levels
Support Levels: $0.00002300, $0.00002000
Resistance Levels: $0.00002610, $0.00003000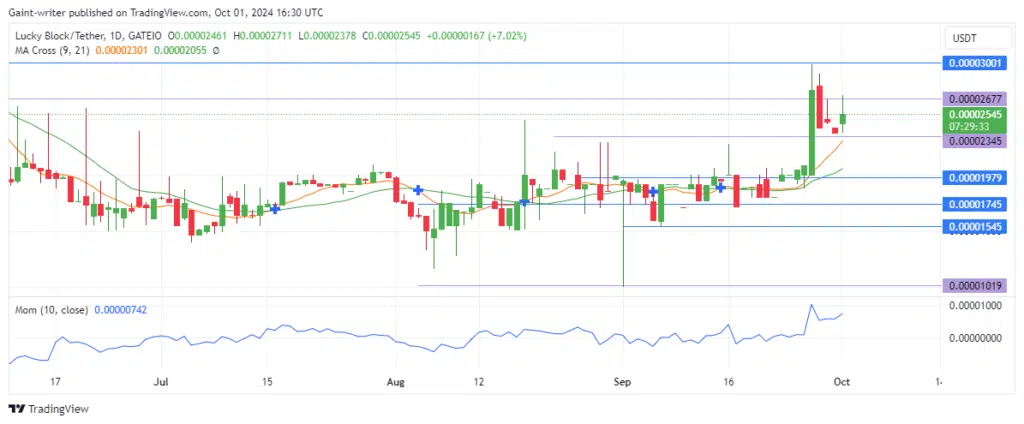
Lucky Block Price Forecast – Expert Analysis & Trading Tips | Learn 2 Trade – Expert Analysis & Trading Tips | Learn 2 Trade: LBLOCKUSD Outlook
Lucky Block Medium Term Trend: Bullish (4-Hour Chart)
In the shorter time frame, buyers are showing renewed strength as they approach the $0.00002600 resistance. The Moving Average crossover indicates a bullish uptrend, with the Momentum indicator aligned, supporting the buyers’ advance.
How To Buy Lucky Block
Note: Learn2.trade is not a financial advisor. Do your research before investing your funds in any financial asset, product, or event. We are not responsible for your investment results.


