
Lucky Block Price Forecast – Expert Analysis & Trading Tips | Learn 2 Trade – Expert Analysis & Trading Tips | Learn 2 Trade – October 25th
Lucky Block price forecast shows buyers continue to rally, aiming to reclaim the $0.00002420 key level despite recent challenges from sellers.
LBLOCKUSD Long-Term Trend: Bullish (Daily Chart)
Key Levels
Support Levels: $0.00001940, $0.00001810
Resistance Levels: $0.00002420, $0.00003100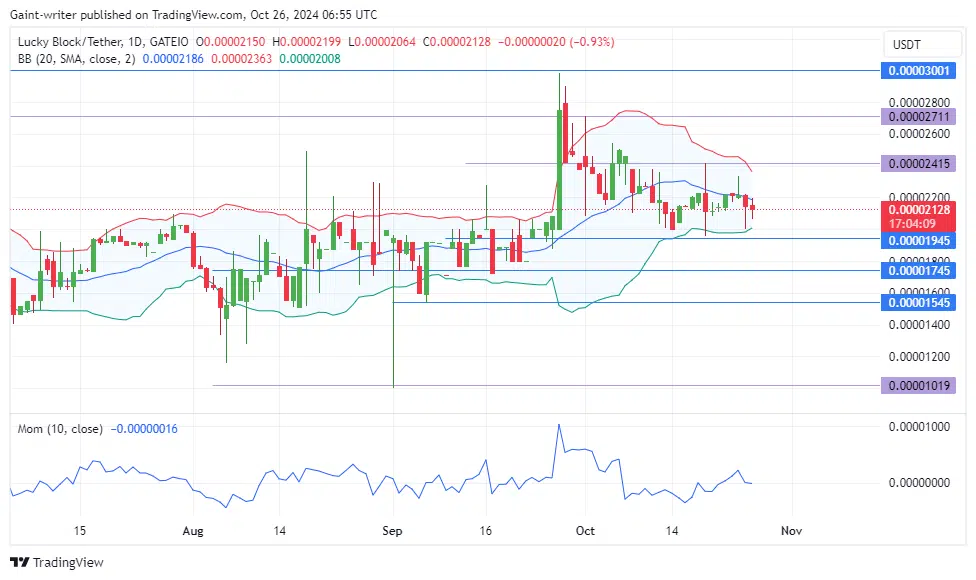
Lucky Block Price Forecast – Expert Analysis & Trading Tips | Learn 2 Trade – Expert Analysis & Trading Tips | Learn 2 Trade: LBLOCKUSD Outlook
The Bollinger Band indicator signals a tight range, implying low volatility and a potential breakout opportunity as liquidity gradually builds.
The Momentum indicator currently rests around the neutral level, suggesting a pause in market direction but potential for buyer re-entry.
While sellers may appear to have the upper hand in the short term, buyers remain poised to make a breakthrough. A breach on the Bollinger Band indicator would confirm buying expansion, potentially driving LBLOCKUSD price closer to the $0.00002420 resistance. However, for this to happen, buyers must maintain pressure and look to create a strong liquidity base for further upward movement.
The market currently presents a cautious but optimistic outlook for buyers. Should they overcome the consolidation phase, the next significant challenge will be at the $0.00002420 level. Conversely, if sellers regain control,may revisit the $0.00001940 support.
LBLOCKUSD Medium-Term Trend: Bullish (4-Hour Chart)
On the shorter time frame, buyers appear determined to push higher, though they face constraints from the Bollinger Band squeeze and a slowdown in the Momentum indicator. This suggests a gradual buildup of market strength but hints that liquidity may take time to increase.
How To Buy Lucky Block
Note: Learn2.trade is not a financial advisor. Do your research before investing your funds in any financial asset, product, or event. We are not responsible for your investment results.


