
LBLOCKUSD Price Forecast – October 30th
The Lucky Block price forecast shows signs of mounting buyer activity as it consolidates around the $0.00002110 level.
LBLOCKUSD Long-Term Trend: Bullish (Daily Chart)
Key Levels
Support Levels: $0.00002000, $0.00001800
Resistance Levels: $0.00002410, $0.00003000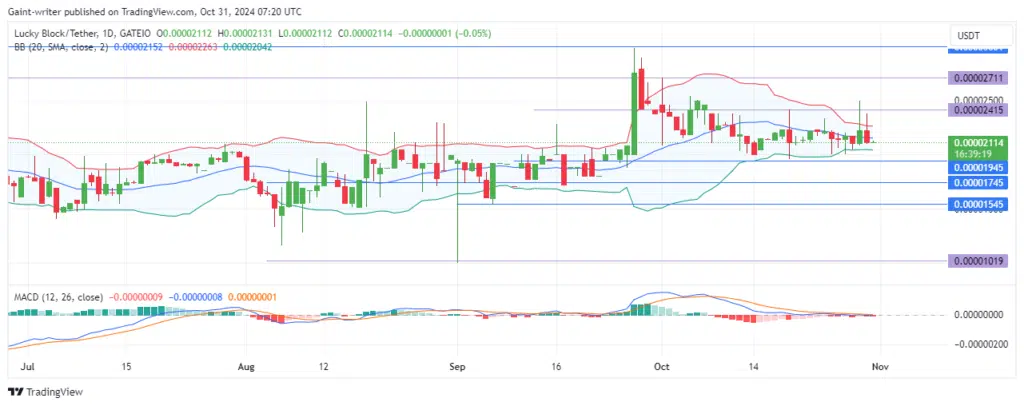
Lucky Block Price Forecast – Expert Analysis & Trading Tips | Learn 2 Trade – Expert Analysis & Trading Tips | Learn 2 Trade: LBLOCKUSD Outlook
LBLOCKUSD Medium-Term Trend: Bullish (4-Hour Chart)
On the 4-hour chart, Lucky Block price continues to accumulate within a tight range. Buyers appear undeterred, and indicators suggest patience as they push for a sustained breakout. The compressed Bollinger Band emphasizes that once expansion occurs, price movement could be swift. 
How To Buy Lucky Block
Note: Learn2.trade is not a financial advisor. Do your research before investing your funds in any financial asset, product, or event. We are not responsible for your investment results.


