
Lucky Block Price Forecast – Expert Analysis & Trading Tips | Learn 2 Trade – Expert Analysis & Trading Tips | Learn 2 Trade – October 31st
The Lucky Block price forecast suggests that LBLOCKUSD may be gearing up for a more substantial move as buyers maintain pressure in a consolidating market.
LBLOCKUSD Long-Term Trend: Bullish (Daily Chart)
Key Levels
Support Levels: $0.00002000, $0.00001810
Resistance Levels: $0.00002430, $0.00003100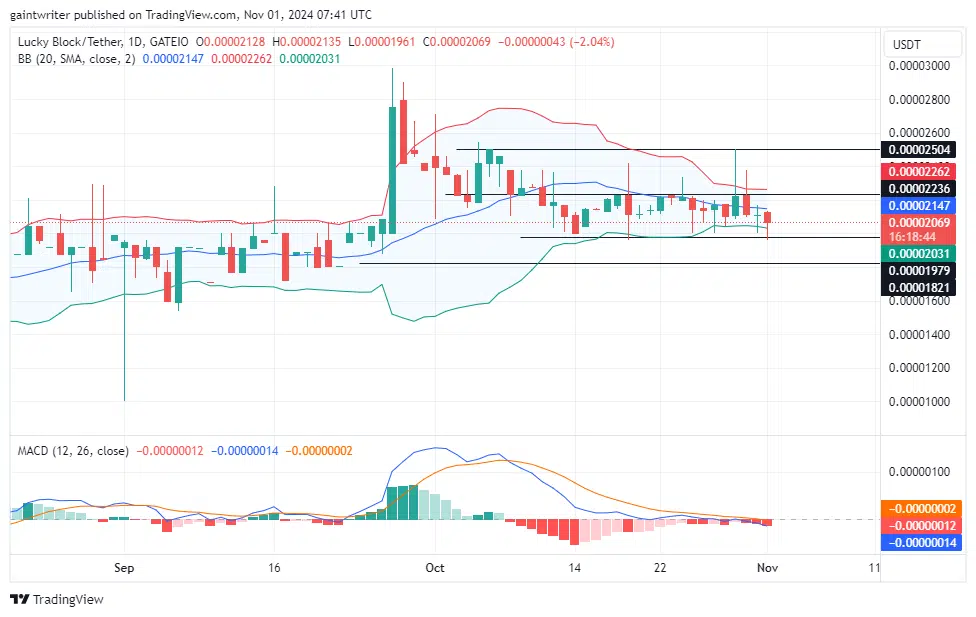
Buyers have shown resilience, keeping the price steady despite ongoing consolidation. The stability in LBLOCKUSD price suggests the presence of committed buyer interest, even as the Bollinger Bands reflect a tightening price range, indicating low volatility.
Lucky Block Price Forecast – Expert Analysis & Trading Tips | Learn 2 Trade – Expert Analysis & Trading Tips | Learn 2 Trade: LBLOCKUSD Outlook
This compression typically signals that the market is in a phase of buildup, with potential for a breakout on the horizon. The ongoing Lucky Block price compression suggests a potential breakout could occur once the market direction strengthens.
With the $0.00002410 resistance level in sight, bulls are likely to aim for a breach, potentially catalyzing a more significant uptrend if sustained. The current price action highlights the persistence of buyer support, with momentum indicators hinting at potential expansion.
The MACD indicator, still balanced near the midpoint, underscores a cautious market stance. However, an upward divergence could develop if buyers intensify pressure, serving as a signal that a breakout may follow. Traders will be watching for any upward MACD movement to validate the strength of a bullish push. A successful push past $0.00002420 key level could leadtowards the $0.00003000 mark, establishing a more substantial uptrend.
LBLOCKUSD Medium-Term Trend: Bullish (4-Hour Chart)
On the 4-hour chart, the LBLOCK market shows similar consolidation patterns, with price movement constrained within a tight range. Despite the subdued activity, buyers have managed to hold steady, reflecting a cautious optimism. 
The 4-hour MACD trend maintains a mild bullish tilt, indicating that buyers remain focused on preserving upward momentum. This will be used in crypto signals.
How To Buy Lucky Block
Note: Learn2.trade is not a financial advisor. Do your research before investing your funds in any financial asset, product, or event. We are not responsible for your investment results.


