

Lucky Block Price Forecast – Expert Analysis & Trading Tips | Learn 2 Trade – Expert Analysis & Trading Tips | Learn 2 Trade – February 6th
Lucky Block price forecast continues its bullish resurgence, with buyers maintaining control and pushing beyond the $0.00004250 key level.
Key Levels:
Support Levels: $0.00002500, $0.00001600, $0.00001900
Resistance Levels: $0.00004800, $0.00005500 $0.00004500
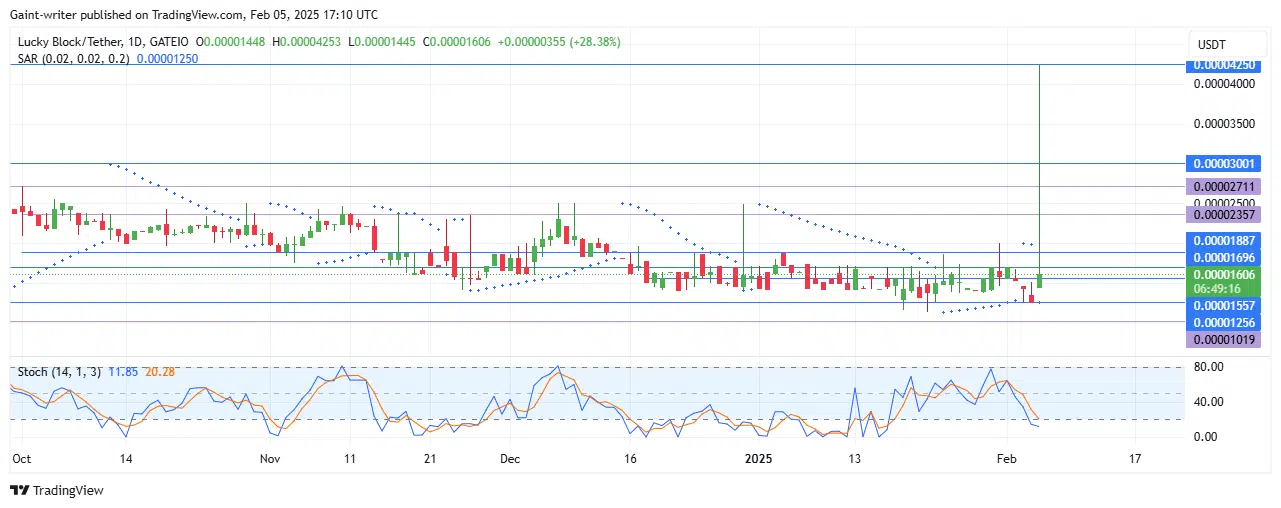
Lucky Block Long Term Trend: Bullish (Daily Chart)
The recent pullback failed to sustain bearish pressure, signalling that sellers have lost strength. Now, buyers are aiming for a larger breakout, leveraging strong momentum to penetrate higher resistance levels. LBLOCKUSD’s bullish momentum is intensifying, with buyers sweeping past consolidation zones and setting up for further price expansion.
.
Lucky Block Price Forecast – Expert Analysis & Trading Tips | Learn 2 Trade – Expert Analysis & Trading Tips | Learn 2 Trade—LBLOCKUSD Outlook
The Stochastic Oscillator is confirming buyer confidence, as sellers lose ground. The Parabolic SAR shows bullish interest growing, further reinforcing buying dominance. If buyers sustain their push, the next major resistance lies at the $0.00004800 key level.
.
There might be a possible break toward the $0.00005500 significant zone if momentum holds. A continued push above $0.00004250 could drive LBLOCKUSD toward $0.00004800, with room for a larger breakout.
.
Also, should buyers lose momentum, a pullback toward $0.00002500 may offer a re-entry point before another push higher. As long as $0.00001600 holds, the overall bullish structure remains intact, keeping buyers in control.

Lucky Block Medium Term Trend: Bullish (4-hour Chart)
On lower time frames, bullish intensity is increasing. The Stochastic Oscillator continues rising, confirming buyers’ momentum.
.
.
How To Buy Lucky Block
Note: Learn2.trade is not a financial advisor. Do your research before investing your funds in any financial asset, product, or event. We are not responsible for your investment results.


