
Lucky Block Price Forecast – Expert Analysis & Trading Tips | Learn 2 Trade – Expert Analysis & Trading Tips | Learn 2 Trade – October 9
The Lucky Block price forecast shows the market consolidating near the $0.00002170 level as pressure builds.
LBLOCKUSD Long Term Trend: Bullish (1-Day Chart)
Key Levels
Support Levels: $0.00002170, $0.00002000
Resistance Levels: $0.00002500, $0.00002670 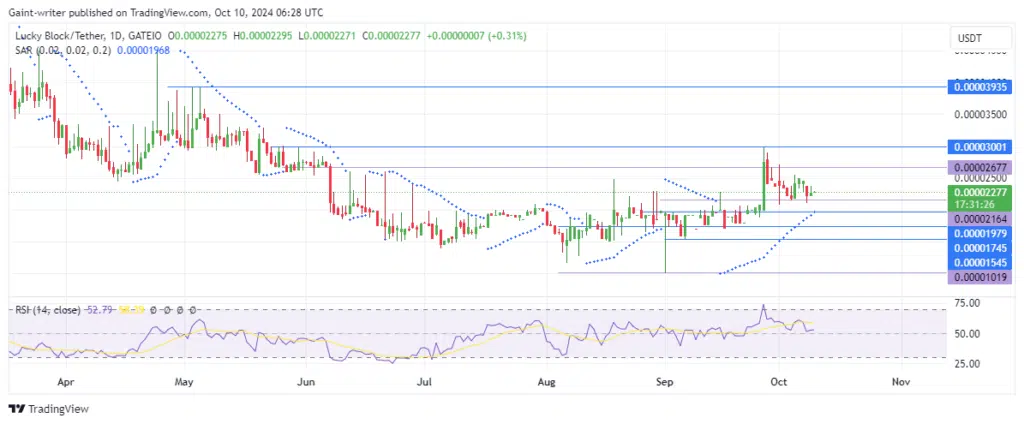
Lucky Block Price Forecast – Expert Analysis & Trading Tips | Learn 2 Trade – Expert Analysis & Trading Tips | Learn 2 Trade: LBLOCKUSD Outlook
Despite the pullback, LBLOCKUSD buyers are showing determination to regain momentum from this support, hinting at a potential breakthrough. The Parabolic SAR indicator reflects ongoing bullish pressure, challenging buyers to push the price higher.
The RSI (Relative Strength Index) currently sits slightly above the mid-range, indicating steady buying interest without a decisive trend. Buyers are focused on maintaining control as they build momentum from $0.00002170.
As theremains in an accumulation phase, buyers are positioning for a possible breakout. The RSI’s placement near the mid-range highlights the ongoing battle between buyers and sellers, though buyers maintain a slight advantage.
Lucky Block Medium Term Trend: Bullish (4-Hour Chart)
In the medium term, buyers continue to sustain momentum on the 4-hour chart, with consolidation around the $0.00002170 level. The Parabolic SAR indicator aligns with buyer activity, signaling potential for upward movement.
How To Buy Lucky Block
Note: Learn2.trade is not a financial advisor. Do your research before investing your funds in any financial asset, product, or event. We are not responsible for your investment results.


