

Lucky Block – Guide, Tips & Insights | Learn 2 Trade Market Prediction – Expert Analysis & Trading Tips | Learn 2 Trade: December 15
The Lucky Block – Guide, Tips & Insights | Learn 2 Trade market prediction is for the price to patiently wait for the right conditions before it launches an aggressive upward thrust.
LBLOCK/USD Long-Term Trend: Bullish (1-Day Chart)
Key Levels:
Zones of supply: $0002980, $0.0002460, $0.0002150
Zones of Demand: $0.0002040, $0.0001990, $0.0001360
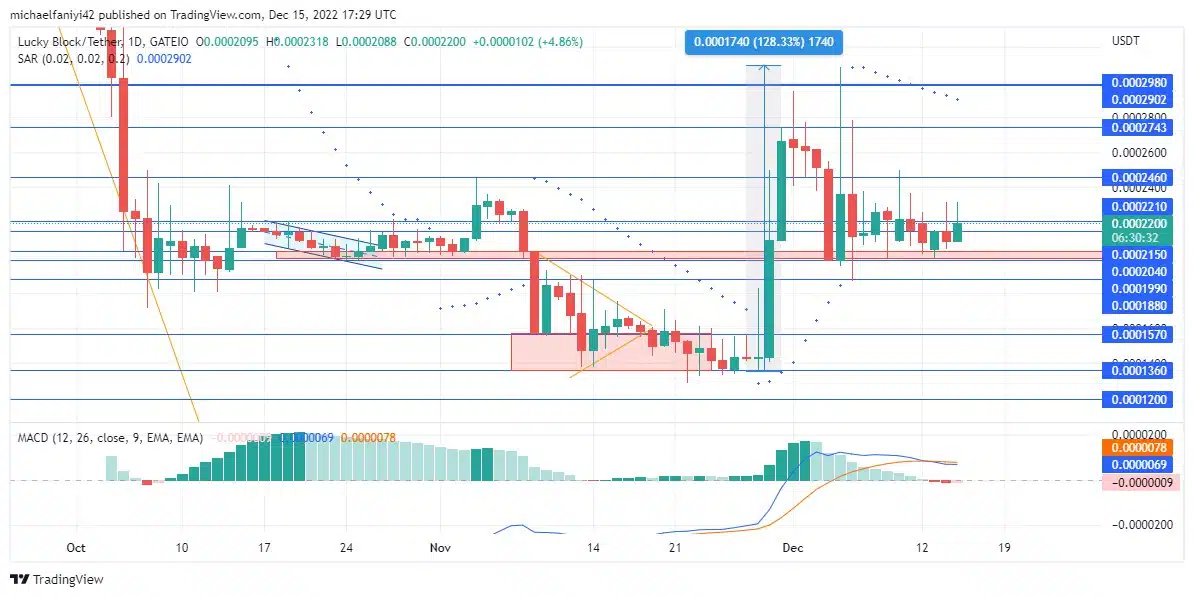
The LBLOCK/USD buyers are patiently waiting for the right opportunity to strike. The price has been thus far limited below the $0.0002980 resistance level and has been trading close to the $0.0002040 demand level ever since. This is not a sign of weakness among the traders; rather, they are patiently waiting for the right time to strike.
Lucky Block – Guide, Tips & Insights | Learn 2 Trade Market Prediction – Expert Analysis & Trading Tips | Learn 2 Trade: LBLOCK/USD Anticipation
Lucky Block – Guide, Tips & Insights | Learn 2 Trade eventually broke the $0.0001990 price line, which had limited its upward movement throughout November.
This leads to more than a 100% price increase, which was curtailed at $0.0002980. The market, therefore, sets its new base level at $0.0002040.
At the new demand level of $0.0002040, the coin has been strategizing to break through its new supply zone. The Parabolic SAR (Stop and Reverse) dots lines above the daily candles as a result of its rejection at $0.0002980.
LBLOCK/USD Medium-Term Trend: Bullish (4-hour chart)
The MACD (Moving Average Convergence Divergence) indicator lines, nonetheless, have risen highly above the zero level in that 1-day timeframe. The drop to the new support level of $0.0002040, on the other hand, has resulted in fewer bullish histogram bars and the formation of a small bearish bar, with the lines lowering their angle of elevation.

Meanwhile, on the 4-hour chart, the MACD lines are fluctuating below the zero level and are instead preparing to rise back to a positive value. In support of this, the long line-up of the Parabolic SAR (Stop and Reverse) dots have been altered and switched below the candles as the buyers begin to rally. A sudden upward thrust will push LBLOCK beyond the $0.0002980 resistance, reaching as high as $0.0004200.
How To Buy Lucky Block – Guide, Tips & Insights | Learn 2 Trade
Note: Learn2.trade is not a financial advisor. Do your research before investing your funds in any financial asset or presented product or event. We are not responsible for your investing results.
- Broker
- Min Deposit
- Score
- Visit Broker

- Award-winning Cryptocurrency trading platform
- $100 minimum deposit,
- FCA & Cysec regulated

- 20% welcome bonus of upto $10,000
- Minimum deposit $100
- Verify your account before the bonus is credited


- Fund Moneta Markets account with a minimum of $250
- Opt in using the form to claim your 50% deposit bonus


