

Lucky Block Market Prediction – Expert Analysis & Trading Tips | Learn 2 Trade: December 14
The Lucky Block market prediction is for the price to keep rising until it reaches the consolidation resistance level in an attempt to break out.
LBLOCK/USD Long-Term Trend: Bullish (1-Day Chart)
Key Levels:
Zones of supply: $0002980, $0.0002460, $0.0002150
Zones of Demand: $0.0002040, $0.0001990, $0.0001360
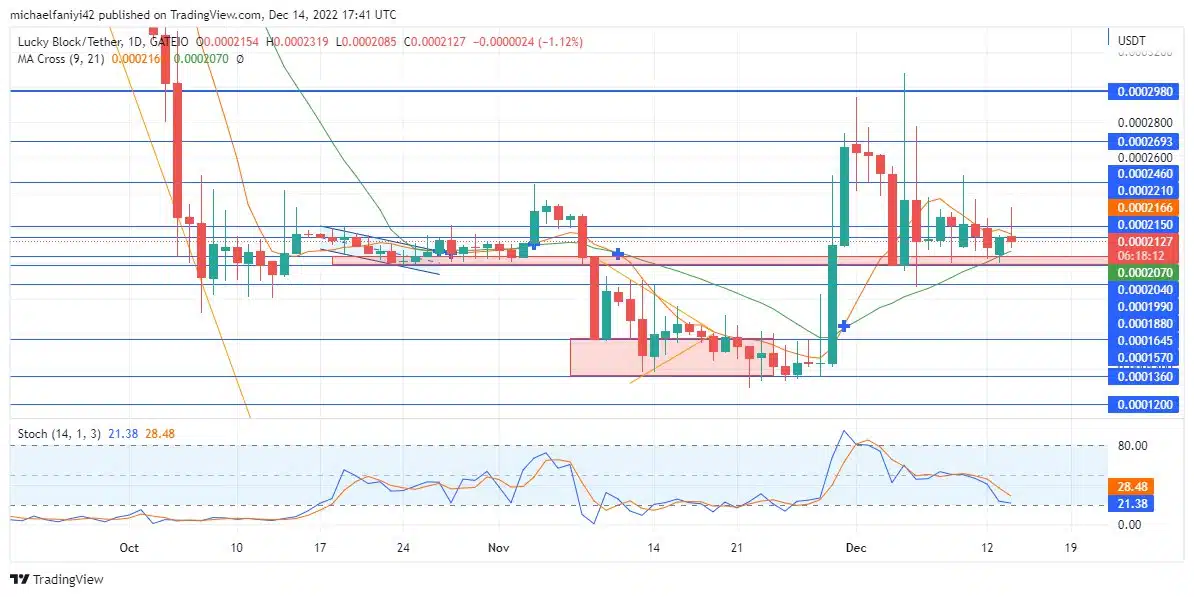
The LBLOCK/USD market is now embarking on an uptrend. The goal of the coin is to rise and test the resistance level for only the third time since the price was initially subdued below the $0002980 resistance level on the 1st of December. The $0.0002040 price level remains a solid demand zone as it keeps the market confined from below.
Lucky Block Market Prediction – Expert Analysis & Trading Tips | Learn 2 Trade: LBLOCK/USD Anticipation
Lucky Block buyers are gradually regaining the market. The first major move was the leap in price from $0.0001360 to $0.0002980. Though the market has since been curtailed, LBLOCK still sits firmly above $0.0002040.
The coin is now locked in another consolidation after being blocked at $0.0002980 but stabilizing at $0.0002040. This will afford buyers a chance to renew their strength and push upward.
The price is currently rising to test the $0.0002980 resistance. If the supply is broken, the market may begin to rise sharply. The stochastic lines are designed to bounce off the border of the oversold region.
LBLOCK/USD Medium-Term Trend: Bullish (4-hour chart)
The price action has widely spaced the MA cross on the daily chart. The lines are, however, coming back together before they cross each other to the upside to reflect the current upward movement in the market.

The market is showing signs of early retracement on the 4-hour chart after the Stochastic lines bounced off the overbought region border. The MA Cross has just made a golden cross to the upside, and the price could directly follow that trend to make a bullish impact up to $0.0004200.
How To Buy Lucky Block
Note: Learn2.trade is not a financial advisor. Do your research before investing your funds in any financial asset or presented product or event. We are not responsible for your investing results.


