

Lucky Block Market Prediction – Expert Analysis & Trading Tips | Learn 2 Trade: January 18
The Lucky Block market prediction is for the coin to keep forging ahead on its rising trendline until the bulls fully take charge of the market.
LBLOCK/USD Long-Term Trend: Bullish (1-Day Chart)
Key Levels:
Zones of supply: $0002980, $0.0002150, $0.00002040
Zones of Demand: $0.0001570, $0.0001360, $0.0001250
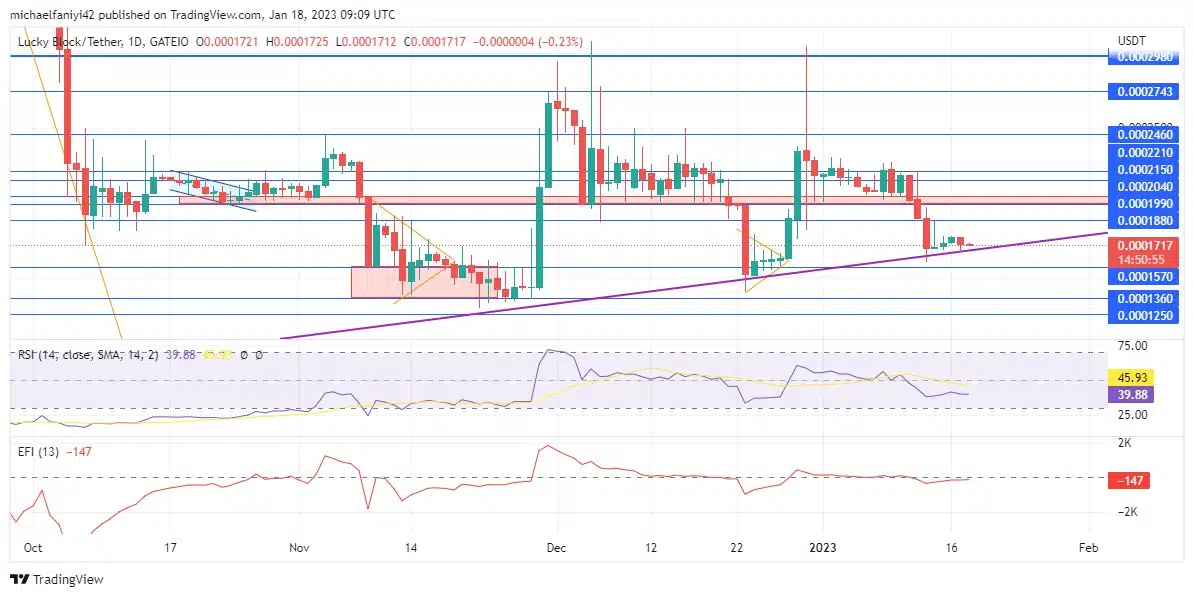
The Lucky Block market is forging ahead on a rising trend as part of its strategy to empower buyers. The recent drop in the market is a continuation of the recent market run. This is needed for the price to taper through the current triangular path and break through the $0.0002980 resistance level.
Lucky Block Market Prediction – Expert Analysis & Trading Tips | Learn 2 Trade: LBLOCK/USD Anticipation
Lucky Block recently took a dip below the $0.0002040 support level on which it was stationed. It was ranging above the level before this occurred, but the inability to push up from there caused the drop.
The drop, notwithstanding, is just another move in the bullish structuring of the market when seen from a more synoptic perspective. The coin is in an upward formation, with $0.0002980 as the supply level.
The EFI (Elders Force Index) power line is about to cross into a positive value as it keeps fluctuating around the zero level. This is the same for the RSI (Relative Strength Index) line, which has spent most of its time above the middle line.
LBLOCK/USD Medium-Term Trend: Bullish (4-hour chart)
On the 4-hour chart, the Relative Strength Index line has gradually slipped from the overbought region and is currently hovering above the oversold region. Although the RSI is now expected to rise back toward the overbought region again.

The EFI power line on the 4-hour chart is seen fluctuating around the zero level until the market drop forced the line to drop further downward. Nevertheless, the line is already recoiling back toward the zero level. The price drop only resulted in a higher high, and the coin is expected to rise again. This will continue till LBLOCKUSD breaks the $0.0002980 resistance level.
How To Buy Lucky Block
Note: Learn2.trade is not a financial advisor. Do your research before investing your funds in any financial asset or presented product or event. We are not responsible for your investing results.


