

Key Highlights
Litecoin loses its critical support at $70
The crypto risks decline to $66 low
Litecoin (LTC) Current Statistics
The current price: $69.22
Market Capitalization: $5,829,636,071
Trading Volume: $432,270,701
Major supply zones: $100, $120, $140
Major demand zones: $80, $60, $40
Litecoin (LTC) Price Analysis July 4, 2024
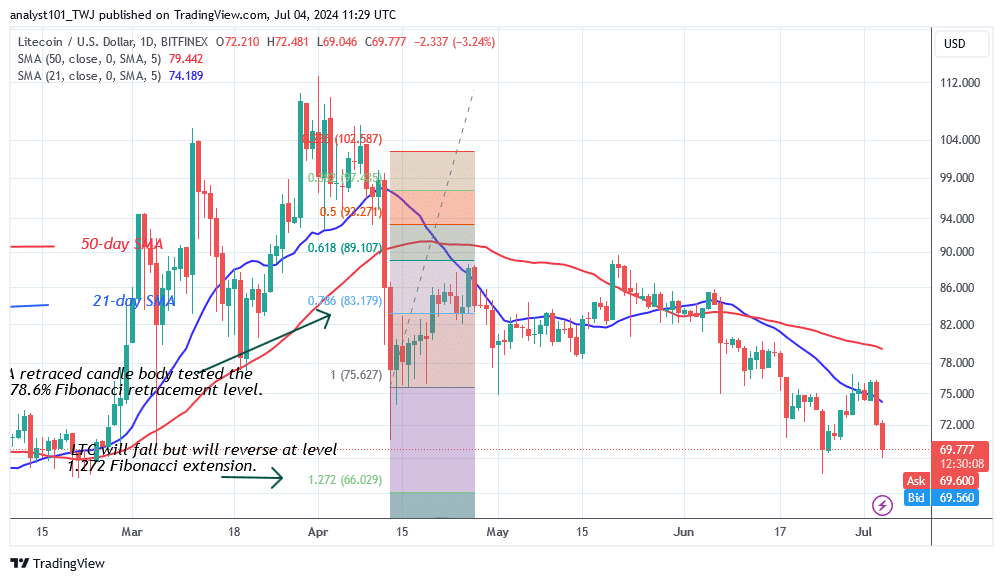
Litecoin’s (LTC) price recovery above the moving average lines seems unlikely as it approaches the $66 low. Furthermore, the bears have broken the crucial support at $70 twice. On April 13, the price indicator anticipated Litecoin’s continued drop.
On May 20, a retraced candle body approached the 78.6% Fibonacci retracement line. The retracement predicts that Litecoin will decrease, but then reverse at the 1.272 Fibonacci extension, or $66.02. In the meantime, Litecoin is currently trading at $69.64.
Litecoin (LTC) Technical Indicators Reading
Since June 7, the price bars have stayed below the moving average lines. As a result, Litecoin is likely to fall even more. The 21-day SMA has been preventing further higher movement in the cryptocurrency. The moving averages are sliding lower, with the 21-day SMA below the 50-day SMA.
Conclusion
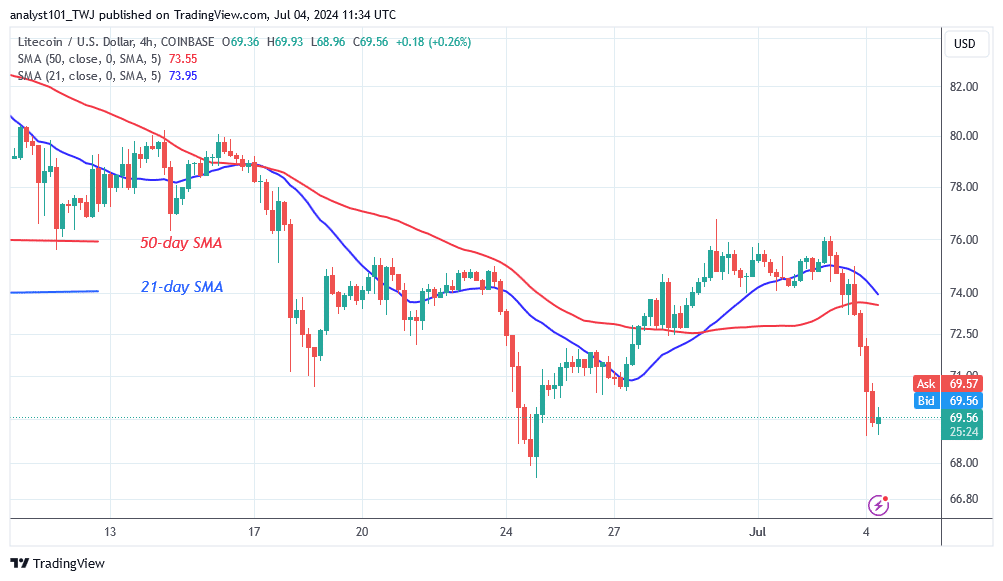
Since June 18, Litecoin has traded between $68 and $76 as it approaches the $66 low. The altcoin has twice fallen below the critical support level of $70 but has remained in a range. The upward advance on July 4 is being rejected at $70. This means that Litecoin will continue to decrease. The crypto signal is unfavorable, with the altcoin facing rejection at its recent high.
Make money without lifting your fingers: Start using a world-class auto trading solution
NOTE: Learn2.Trade is not a financial advisor. Do your research before investing your funds in any financial asset or presented product or event. We are not responsible for your investing results.

