

Litecoin (LTC) Price Analysis: Daily Chart – Bearish
Key resistance levels: $57, $60, $63, $70
Key support levels: $50, $47, $43, $40
Litecoin’s volatility is fading away on the daily chart as price surge lurks around on the descending wedge pattern. As it appeared now, Litecoin is at the verge of rolling over to the wedge’s support but the price slowly drops. We can expect the price to slip at $50, $47, $43 and $40 support as soon as the selling pressure trigger heavily.
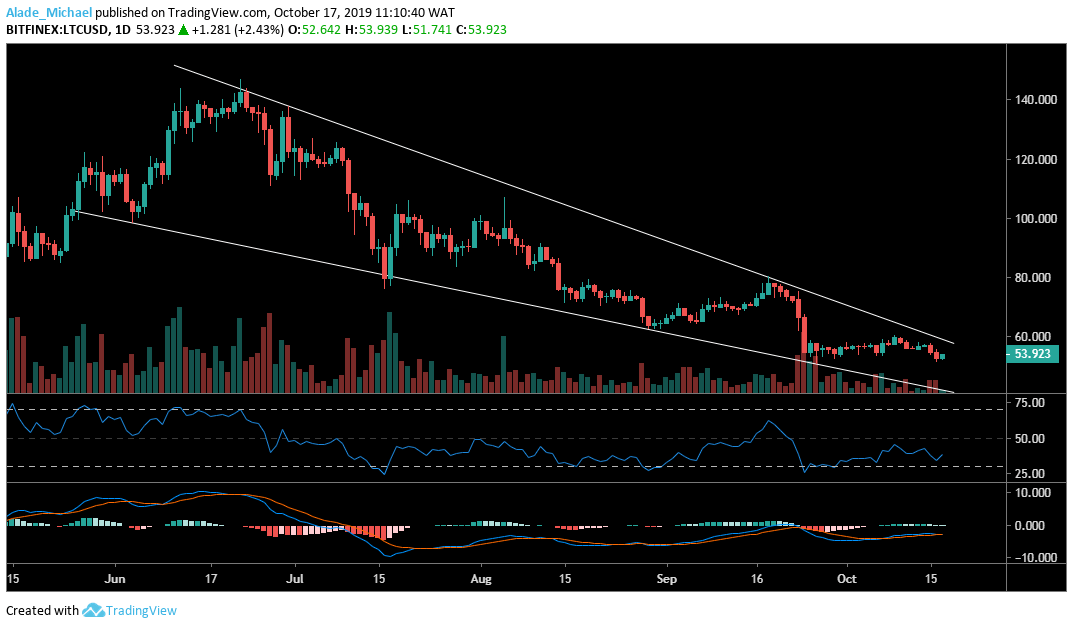
As we can see, the technical indicators are still hovering around their negative zone. Pushing through the mid-level could sense a bullish move for the LTC/USD pair, bringing the market to $57 and $50 resistance before we can see a price break to $63 and $70. But it is now, the crypto trading signals that the bears are still present.
Litecoin (LTC) Price Analysis: Hourly Chart – Bearish
The weekly short opening has made the Litecoin’s price to following a bearish scenario on the 4-hour chart as the trading shapes inside a descending channel pattern. After rebounding at the channel support, the price is now nearing the channel’s resistance, where rejection is likely to play out.
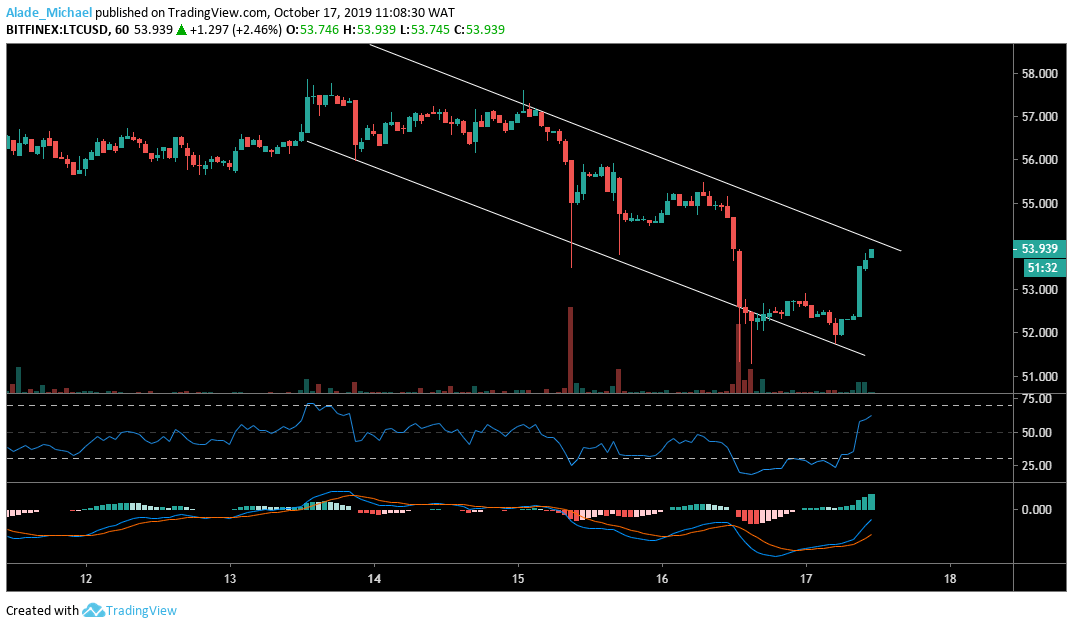
We can expect a price fall to $52 shortly. Meanwhile, the RSI has seen a bullish climb. If the crypto trading signals a cross above the MACD zero level, the price LTC could hit $55 and $57 resistance. For now, a bearish continuation is more likely to play out.
LITECOIN SELL SIGNAL
Sell Entry: $54
TP: $51
SL: $55

