A combination of factors has influenced the Japan 225 market, leading to a retracement after reaching the 40,000 threshold. Concerns surrounding the newly introduced Chinese AI model have impacted Japanese stocks as well as the Nvidia market. Additionally, stocks related to computer chips have been influenced by the performance of the Nasdaq in the United States. However, an upward retracement in bank shares has provided some recovery, an effect reflected in the Nikkei 225 market.
Key Price Levels:
Resistance Levels: ¥40,000, ¥41,000, ¥42,000
Support Levels: ¥39,000, ¥38,000, ¥37,000
Japan 225 Market May Bounce Back
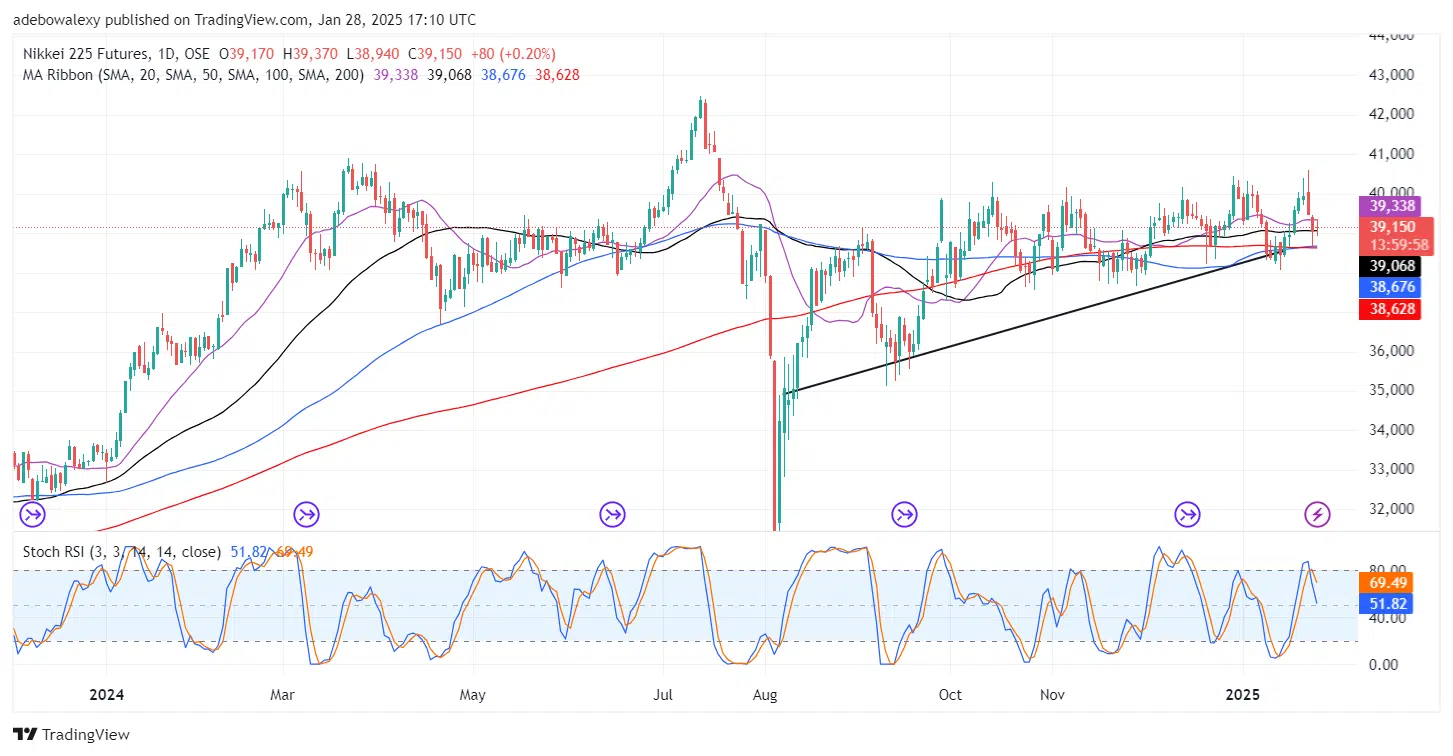
Although the Nikkei 225 market experienced a notable price slump over the past two sessions, price action remains above critical levels. The current session’s price candle is sustaining above the 50-day Moving Average (MA). Furthermore, the candle has contracted significantly, resulting in a small body.
This contraction suggests a tug-of-war between price forces. Meanwhile, the Stochastic Relative Strength Index (RSI) is falling toward the 50 level, reflecting the bearish momentum of the previous session. However, the fact that price action remains above most MA lines offers a positive outlook for the market.

Nikkei 225 at a Short-Term Higher Low
Zooming into the Japan 225 market in a 4-hour time frame reveals that despite the sharp downward retracement, the market is still on a short-term upward trajectory. However, price action has fallen below all the MA curves. The corresponding price candle for the ongoing session appears red, indicating a downward retracement, while the MA lines continue to converge above the price action.
Nevertheless, the last price candle on the chart is contracting, hinting that upward forces are counteracting the downward movement. Additionally, the Stochastic RSI lines are projected slightly upward but remain below the 40–50 range. Therefore, despite recent challenges, traders may remain optimistic about the ongoing upward retracement toward the 40,000 mark.
Do you want to take your trading to the next level? Join the best platform for that here.