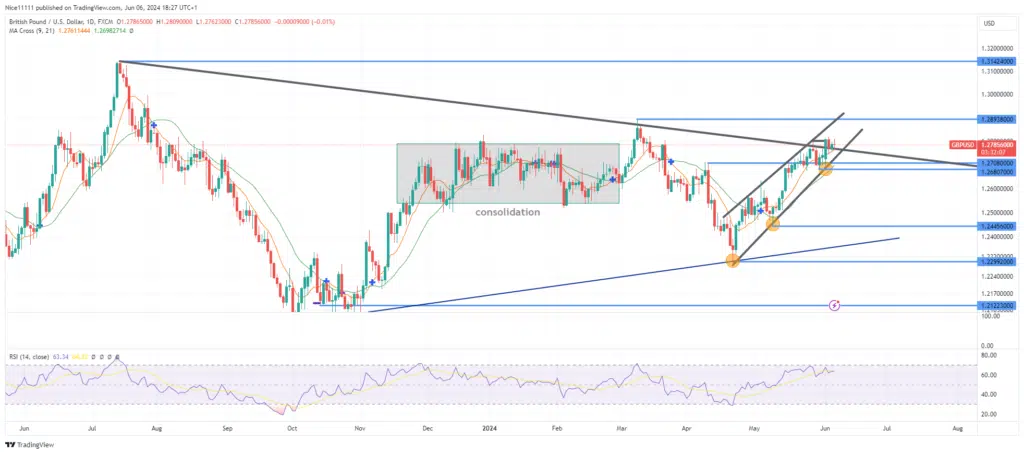
GBPUSD tipped above a major resistance trendline on the daily chart on the 28th of May, suggesting a potential breakout. Following this breakout, the price pulled back to a bullish order block near the resistance trendline. After finding support in this bullish order block, the price propelled upward, establishing a new break of structure and sustaining the bullish trend.
GBPUSD Key Levels
Demand Levels: 1.2300, 1.2450, 1.2700
Supply Levels: 1.2900, 1.3140, 1.3500
GBPUSD Long-term Trend: Bullish
The market is currently in a bullish trend. The recent bearish trend ended with a test of the major resistance trendline on the daily chart. The emergence of the current upward trend was fostered by the bullish trendline.
The major resistance trendline posed a significant challenge to the bullish swing. However, the Moving Averages supported the market ascent prior to testing the resistance trendline. Additionally, the Relative Strength Index (RSI) signalled that the market was maintaining its bullish trajectory.
GBPUSD Short-term Trend: Bullish
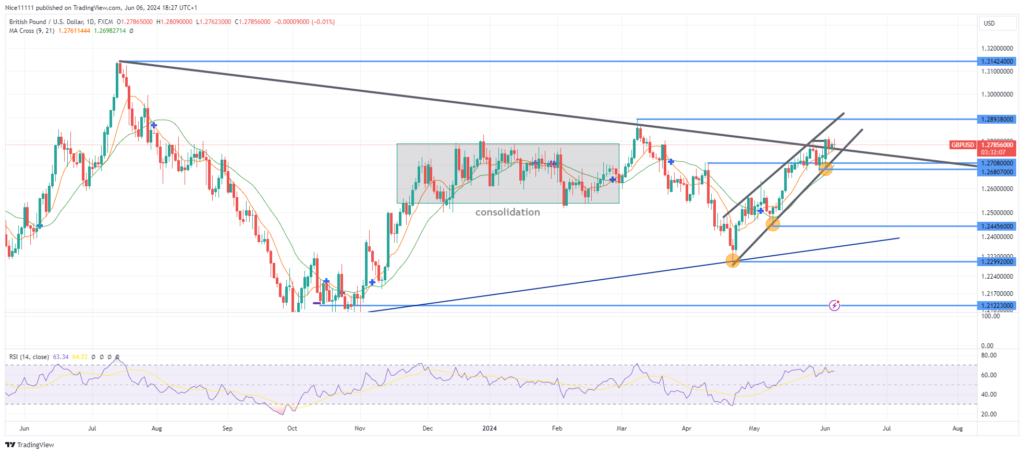
GBPUSD gradually pushed above the resistance trendline, solidifying its breakout with a bullish structure. After pulling back to find support, the price established a new break of structure, reinforcing the bullish stance. Analysts are likely to target the next resistance level of 1.2900 for forex signals, anticipating further upward movement.
This bullish development indicates a strong potential for continued upward momentum in the GBPUSD pair, offering favourable conditions for traders looking to capitalize on the trend.
Note: Learn2.trade is not a financial advisor. Do your research before investing your funds in any financial asset or presented product or event. We are not responsible for your investing results.
We use cookies to ensure that we give you the best experience on our website. If you continue to use this site we will assume that you are happy with it.

 GBPUSD Short-term Trend: Bullish


