

Ethereum (ETH) Current Statistics
The current price: $2,511.68
Market Capitalization: $303,220,475,395.04
Trading Volume: $11,192,085,711.43
Major supply zones: $3,500, $4,000, $4,500
Major demand zones: $2,500, $2,000, $1,500
Ethereum (ETH) Price Analysis June 7, 2025
The price of Ethereum (ETH) dropped below the 21-day SMA support as it faces the $2,600 barrier. The largest altcoin has been trading in a range between the $2,400 support and the $2,800 resistance. If the price of Ether doesn’t break above the 21-day SMA level, it may continue to fall to the downside. Ether will decline above the 50-day SMA support.
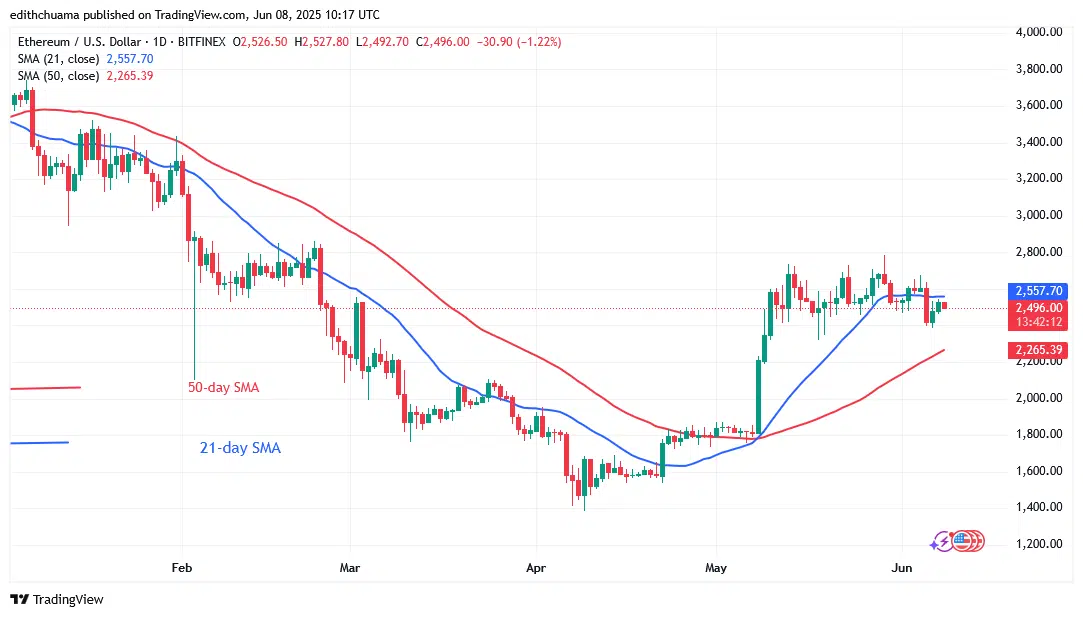
ETH Technical Indicators Reading
The price bar for Ether is rising since it is above the 50-day SMA support and below the 21-day SMA.The price of the cryptocurrency is trapped between the moving average lines as the altcoin keeps moving in a range. Ether’s bullish trend will resume once it surpasses the 21-day SMA barrier. On the other hand, if the cryptocurrency asset drops below the 50-day SMA support, it will continue to lose value.
Conclusion
Ethereum is trading between the moving average lines as it faces the $2,600 barrier. Ether is likely to drop even more if it breaches the 21-day SMA support. The price of cryptocurrency will gradually decline to the low above the $2,200 or 50-day SMA support. The altcoin’s cryptocurrency signal is negative as it loses the 21-day SMA support.

Make money without lifting your fingers: Start using a world-class auto trading solution.
Note: Learn2.Trade is not a financial advisor. Do your research before investing your funds in any financial asset presented product, or event. We are not responsible for your results.


