Ethereum (ETH) Current Statistics
The current price: $3,274.87
Market Capitalization: $395,697,696,396.56
Trading Volume: $20,155,636,759.67
Major supply zones: $3,500, $4,000, $4,500
Major demand zones: $2,500, $2,000, $1,500
Ethereum (ETH) Price Analysis January 25, 2025
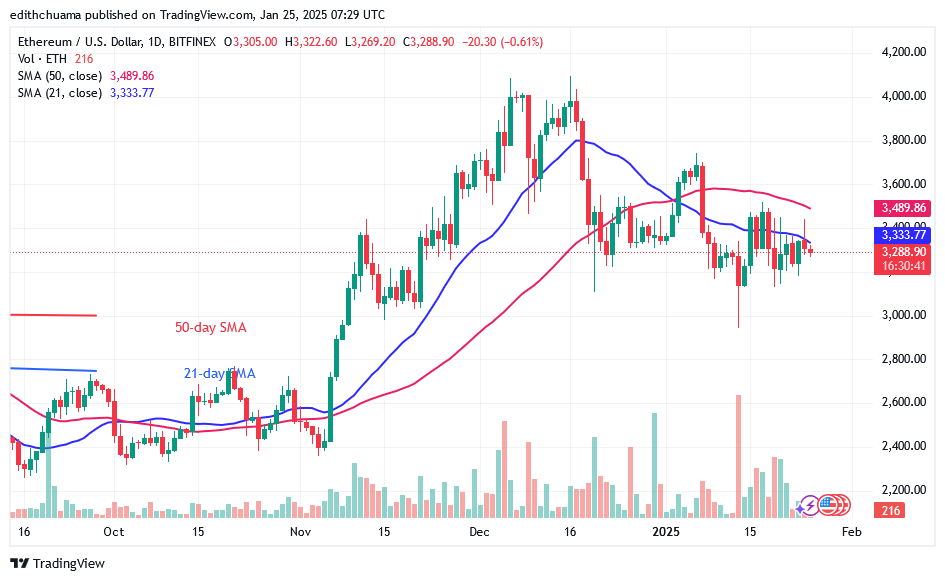
Ethereum’s (ETH) price trades below the moving average lines despite intense rivalry. On January 13, Ether dropped quickly and violated the $3,000 key support but recovered above the $3,100 support. The altcoin has been trading above the $3,100 support but below the moving average lines for the past week. The goal of buyers has been to raise the price above the 21-day SMA. Three times, the crypto’s upward rise has been repelled by the 21-day SMA.
ETH Technical Indicators Reading
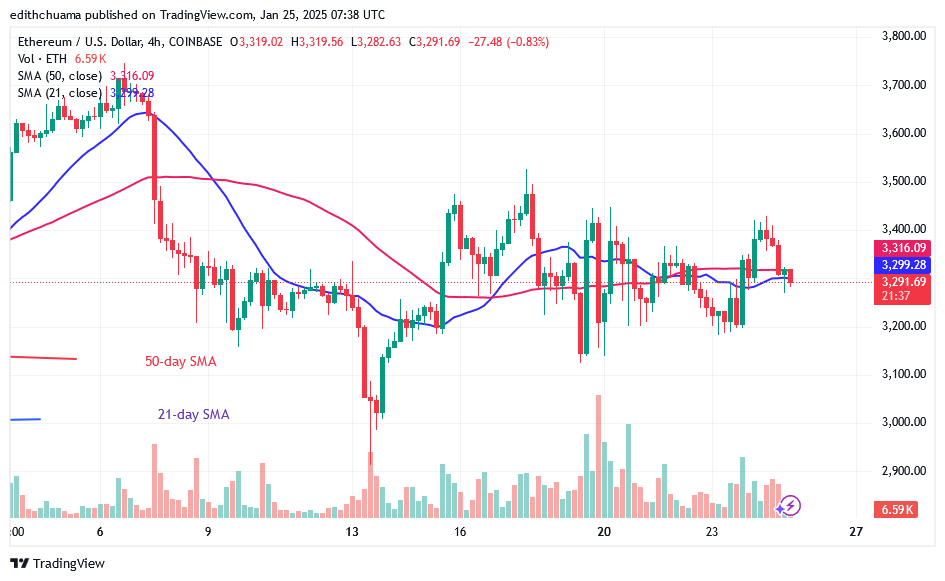
The sideways trend is indicated by the horizontal lines of the 21-day and 50-day moving averages. The cryptocurrency’s price bars are encountering resistance from the 21-day SMA barrier line. The price bars on both charts show a potential decrease because they are below the moving average lines.
Conclusion
Ether is trending sideways on the 4-hour chart despite intense rivalry. The biggest altcoin fluctuates between the $3,100 support and below the $3,500 barrier. The price bars exhibit uniform oscillations both beneath and above the lines of the moving average. Candlestick wicks are pointing toward the $3,500 resistance level. These suggest that there is significant selling pressure at the $3,500 high. The crypto signal will remain range-bound as long as the range-bound values are present.
Make money without lifting your fingers: Start using a world-class auto trading solution.
Note: Learn2.Trade is not a financial advisor. Do your research before investing your funds in any financial asset or presented product or event. We are not responsible for your results.