Ethereum (ETH) Current Statistics-a Further Decline
The current price: $3,179.93
Market Capitalization: $382,936,610,330.08
Trading Volume: $31,856,280,606.23
Major supply zones: $3,500, $4,000, $4,500
Major demand zones: $2,500, $2,000, $1,500
Ethereum (ETH) Price Analysis November 16, 2024-a Further Decline
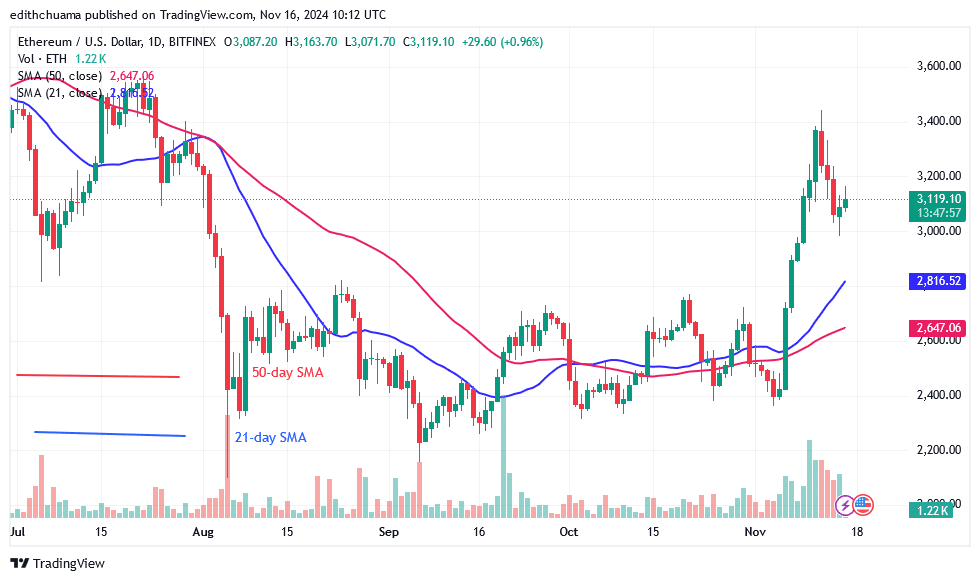
Ethereum’s (ETH) price is falling and has stuck at $3,200, indicating a further decline. The upward movement is met with resistance at the $3,200 high. For the past 48 hours, the largest altcoin has fluctuated in a small range, trading above the moving average lines. On the upside, if buyers surpass the $3,200 resistance, Ether will increase and retest or break the $3,400 resistance level. This will help the altcoin hit a high of $3,800 or $4,000.
ETH Technical Indicators Reading
Ether price bars are significantly higher than the moving average lines. The price bars have retraced and halted above the $3,000 level. The altcoin will further decline to the low above the 21-day SMA support if it loses the $3,000 support. On the 4-hour chart, the price bars fall below the moving average lines. On the 4-hour chart, a further decrease is indicated by the price bars being below the moving average lines.
Conclusion
On the 4-hour chart, Ether’s upward move has been hampered by the resistance at $3,200, indicating a further decline. Meanwhile, on November 13, a retraced candle body tested the 38.2% Fibonacci retracement level, implying that Ether will fall to level 2.618 Fibonacci extension, or $2,680.72.

Make money without lifting your fingers: Start using a world-class auto trading solution.
Note: Learn2.Trade is not a financial advisor. Do your research before investing your funds in any financial asset or presented product or event. We are not responsible for your results.