

Buyers’ momentum increase in BNB market
BNBUSD Price Analysis: 28 March
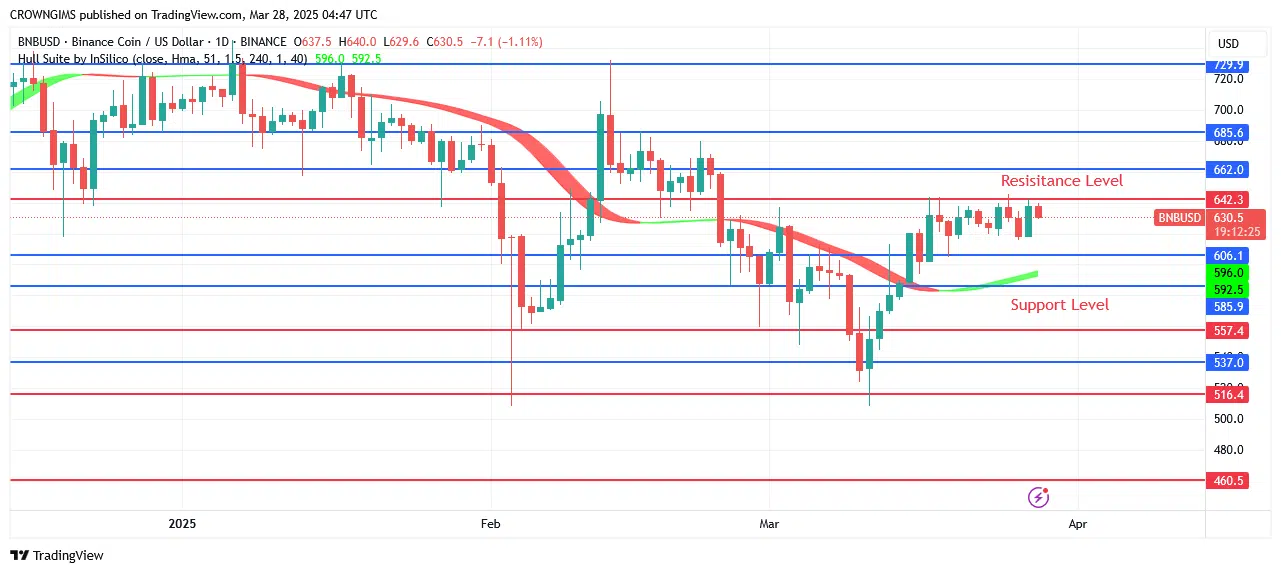
If buyers can hold onto the $606.1 support level and break above the $642.3 resistance level, they might be able to drive the price to test the $662.0 and $685.0 resistance levels. If BNB can break through the crucial $606.1 barrier, it should target the previous lows of $585.9 and $557.7.
Key levels:
Supply levels: $642.3, $662.0, $685.0
Demand levels: $606.1, $585.9, $557.7
BNBUSD Long-term Trend: Bullish
The BNBUSD daily chart is positive. The price of the cryptocurrency dropped further on December 9, from $729.9 to $557.7. Despite some resistance, as the bears’ strength increased, they broke the aforementioned barrier. The market is dominated by selling, as demonstrated by BNB’s latest decline below $585.9. At the expected support level, there were signs of a favorable reversal. The price’s most recent flip at $557.7 indicates that buyers would take a greater offer, which is consistent with the upward trend. The price increased following a retesting at its prior low of $557.7. It currently costs roughly $642.3.
BNBUSD medium-term Trend: Bullish
The coin’s positive effects may cause the price of BNBUSD to increase during the course of the next four hours. The BNB tested at $585.9 and then started to rise. We learned that $729.0 had been paid in total on February 3. The price flipped above the target level due to the bulls’ fury. The lowest price was $606.1 yesterday. Today, the price is getting close to $642.3.

Start using a world-class auto trading solution
You can purchase Lucky Block here. Buy LBLOCK


