

Sellers are dominating BNBUSD market
BNBUSD Price Analysis: 06 September
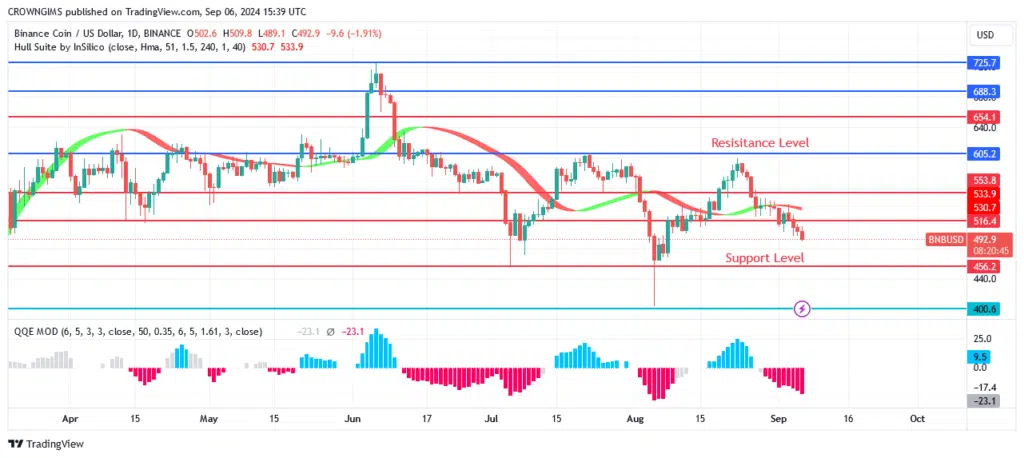
Buyers may be able to push price to test the $553 and $605 resistance levels if they can hold onto the $456 support level and break past the $516 resistance level. BNBUSD is expected to test the previous lows of $400 and $361 if it is able to break below the critical $456 barrier.
BNB/USD Market
Key levels:
Supply levels: $516, $553, $605, $654
Demand levels: $456, $400, $361
BNBUSD Long-term Trend: Bearish
A lot of bearish action can be seen on the daily chart of BNBUSD. A few weeks ago, the value of the cryptocurrency fell from $654 to $516. The $654 barrier, which was a level of support earlier, became a level of resistance as the bears gathered momentum. The week before, buyers controlled the BNB market, and the price reached a high of $654. At the specified resistance level, there were signs of a negative reversal. There has been a reversal in the direction of $516, as sellers are prepared to break with the upward trend and reduce the price. As of right now, the price is dropping approaching $456 level.
BNBUSD medium-term Trend: Bearish
The detrimental effect on the cryptocurrency may cause the price of BNBUSD to drop during the course of the following four hours. The BNB broke past the $553 mark and then started to decline sharply. This was brought to our attention on August 24. The total amount spent was $516. The momentum of the bears caused the price to break below $516 on September 04. It currently costs $456.

The BNB trade is currently below the Hull Suite indicator. The QQE MOD indicator’s signal line is below zero, signifying a heavy sell.
Start using a world-class auto trading solution
You can purchase Lucky Block here. Buy LBLOCK


