

The Quant token has been on a sustained upward trajectory for an extended period. Today, that trend continues, with the market advancing sharply. As of the time of writing, the token has posted an additional price gain of 4.65%. Let’s take a closer look at the market details.
QNT Statistics
Current Price: $131
Market Capitalization: $1.56B
Circulating Supply: 12.07M
Total Supply: 14.88M
CoinMarketCap Rank: 60
Key Price Levels
Resistance: $135, $140, $145
Support: $130, $125, $120
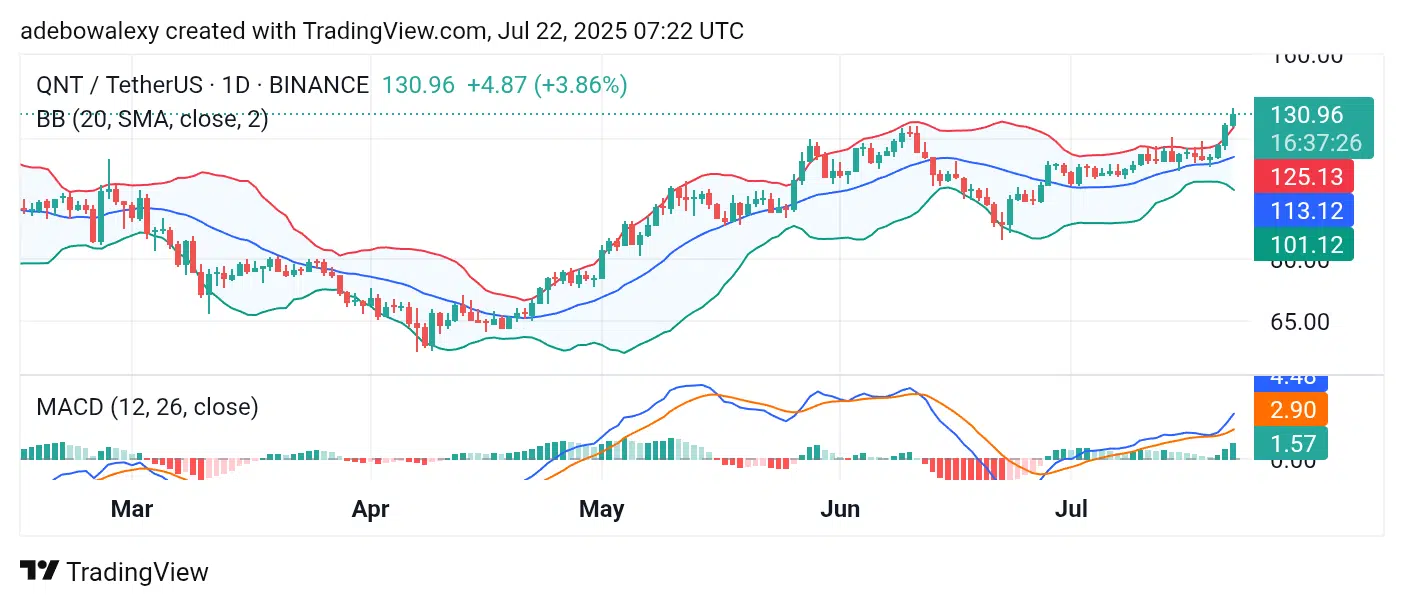
QNT Maintains a Sharp Upward Trajectory
Price action on the Quant daily chart has recently rebounded from a key technical level. Over the past three sessions, the price bounced off the middle band of the Bollinger Bands (BB) indicator. A closer examination reveals that momentum has strengthened as the market progresses.
The current session’s price candle now stands above the uppermost limit of the BB indicator. Meanwhile, the Moving Average Convergence Divergence (MACD) indicator lines have taken a more bullish stance, with the lines diverging upward, signaling strong momentum.

Quant Eyes the $140 Resistance Level
On the 4-hour chart, the QNT market continues to gather momentum. Price action has consistently hovered near the upper band of the BB indicator and has now broken above it. The latest price candle in the ongoing session remains green, confirming bullish sentiment.
Additionally, the MACD lines are following a steep upward trajectory, while the histogram bars have regained a solid green appearance. Technically, these signals indicate that bullish momentum remains intact. As a result, the $135 level appears to be an achievable short-term target, even though a minor downward correction may still occur.
Make money without lifting your fingers: Start trading smarter today


