

Quant Price Forecast: February 18
The Quant price forecast suggests that the coin is still making persistent efforts to break out of the $101.65 – $91.80 transition zone. A successful breakout would push the price back into a consolidation phase.
Quant Long-Term Trend: Bearish (1-Day Chart)
Key Levels
Supply Levels: $120.95, $101.65
Demand Levels: $91.80, $73.00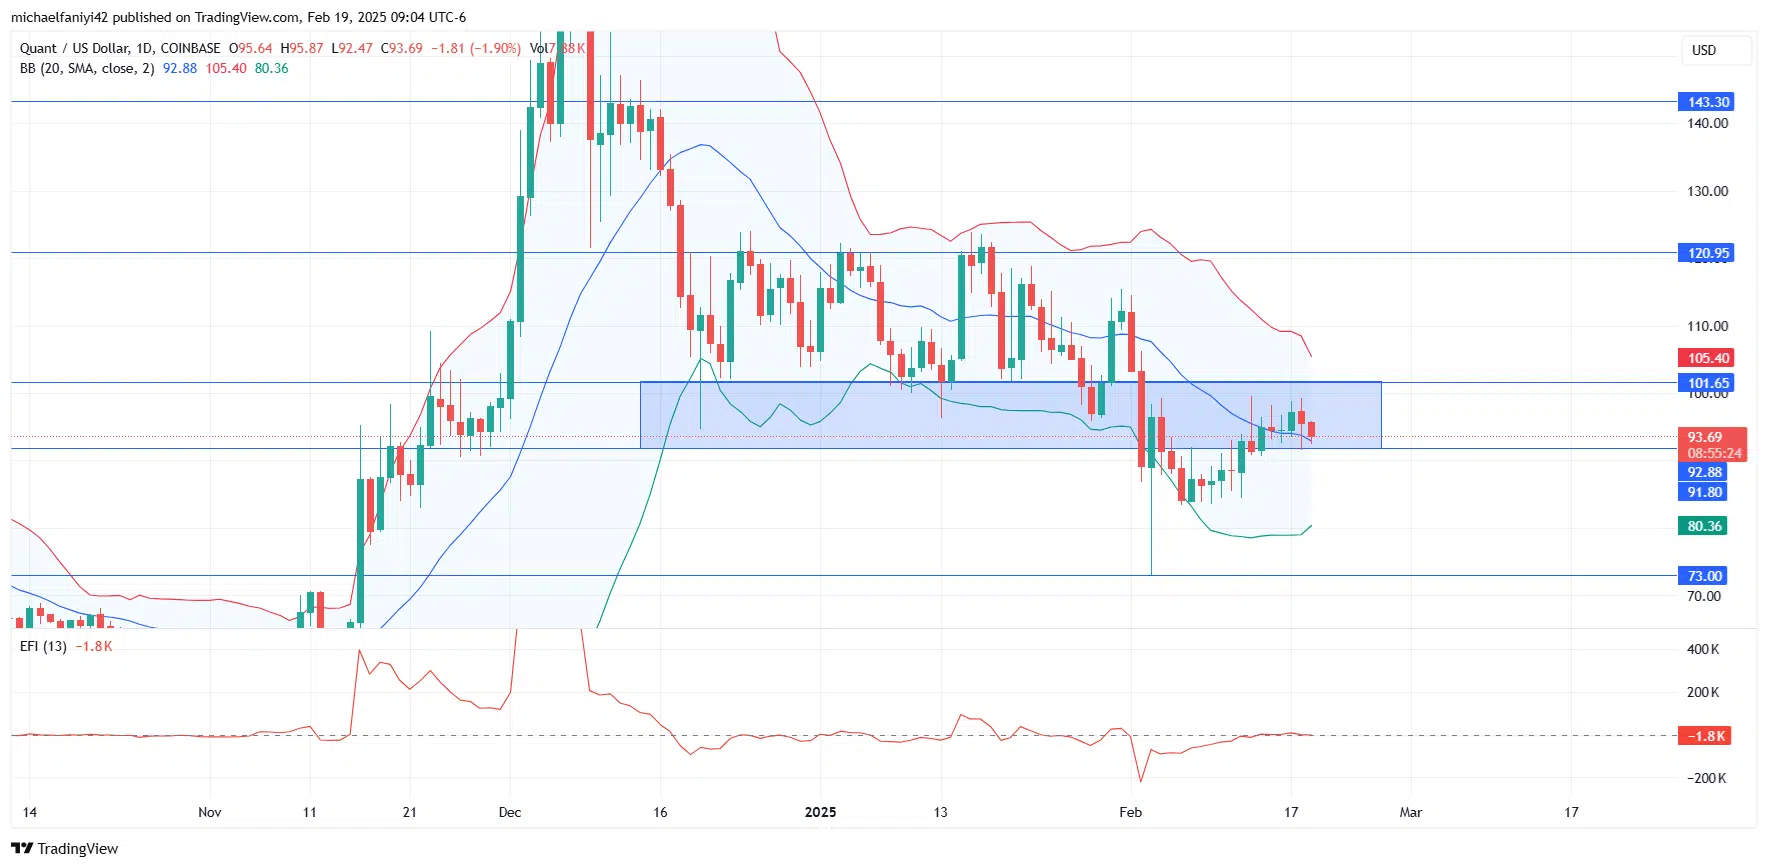
Quant Price Forecast: QNT/USD Outlook
Thebut continues to struggle at the $101.65 resistance level.
This upward movement has positioned the price above the middle Bollinger Band, but further momentum is needed to drive it higher.
The Elders Force Index (EFI) power line remains at equilibrium, indicating that neither bulls nor bears currently have a clear advantage in the market.
QNTUSD Medium-Term Trend: Bullish (4-Hour Chart)
The 4-hour timeframe indicates that buyers need additional strength to break through the $101.65 resistance level. The EFI power line, which initially stayed above equilibrium, has now dropped below it, reflecting weakening bullish momentum.
Make money without lifting your fingers: Start using a world-class auto trading solution
How To Buy Lucky Block
Note: Learn2.trade is not a financial advisor. Do your research before investing your funds in any financial asset, product, or event. We are not responsible for your investment results.


