
Polkadot (DOT) Price Long-term Trend: Ranging
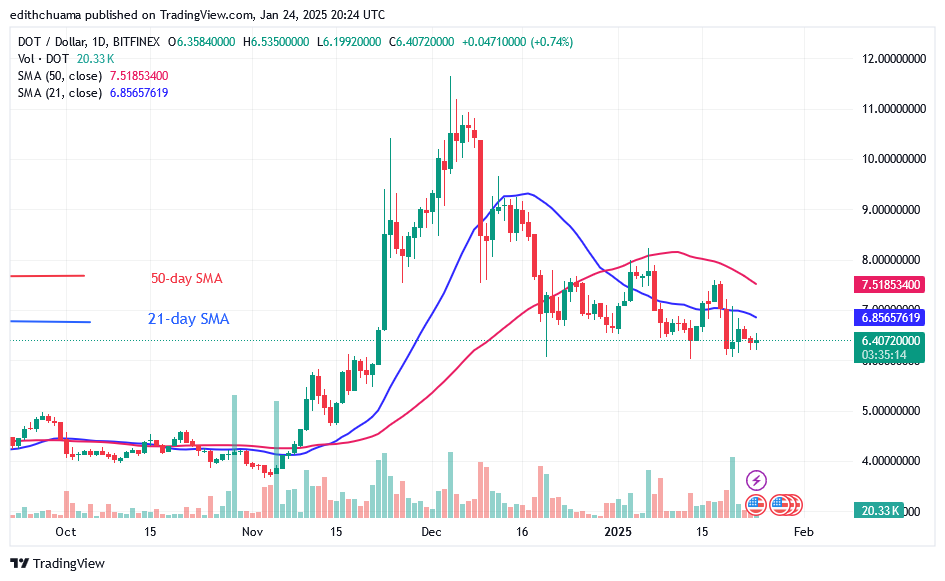
Polkadot’s (DOT) price trend has been constant but faces a probable dip below $6.00. The resistance at $8.00 and the 50-day SMA have slowed price gains. On January 19, the cryptocurrency price dropped below the moving average lines, reaching a low of $6.10. For the past week, the altcoin has been consolidating above the $6.00 support but below the 21-day moving average.
Technical indicators:
Key Resistance Levels: $10, $12, $14
Key Support Levels: $5, $3, $1
Polkadot Indicator Analysis
The existence of Doji candlesticks has caused price movement to remain stationary. The price bars are below the horizontal moving average lines, indicating that the cryptocurrency will continue to decrease. The moving average lines show a bearish crossover, giving bearish signs.
General Outlook for Polkadot (DOT)
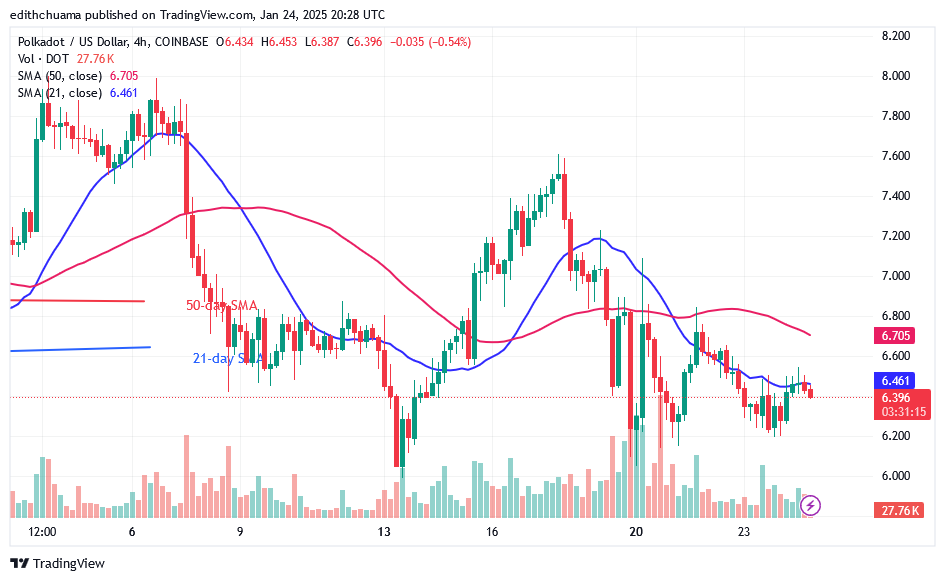
Polkadot is dropping below the moving average lines but faces a probable dip below $6.00. The altcoin’s bullish advances are being rejected at the 21-day SMA, prompting it to fall to and revisit the important support level at $6.00. However, if the crucial support is lost, the DOT price might drop even lower, to $5.00. Meanwhile, the cryptocurrency signal remains range-bound as the altcoin consolidates above the $6.00 support.
Make money without lifting your fingers: Start using a world-class auto trading solution.
Note: Learn2.Trade is not a financial advisor. Do your research before investing your funds in any financial asset or presented product or event. We are not responsible for your investment.


