

Polkadot (DOT) Price Long-term Trend: Bullish
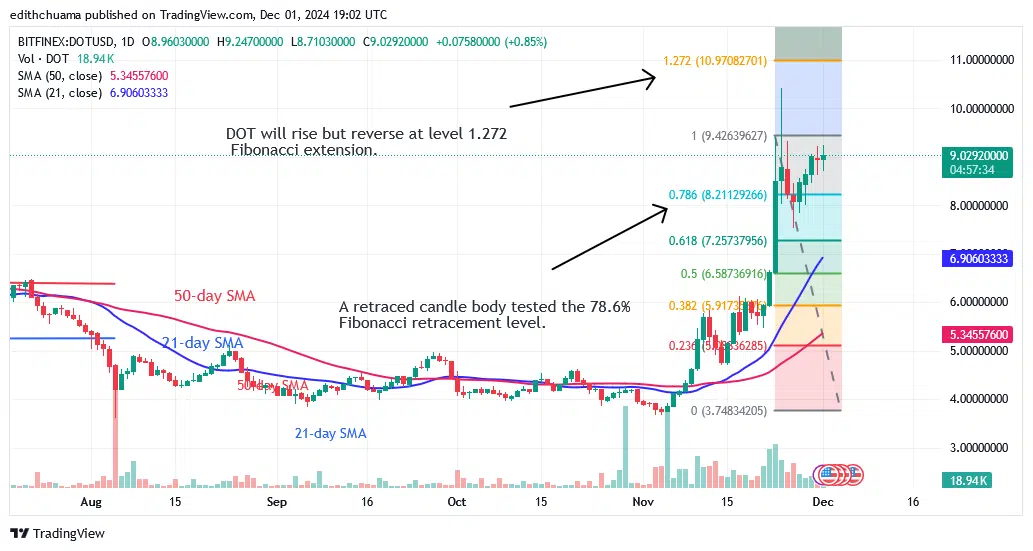
Polkadot’s (DOT) price pauses as it reaches an overbought area. On November 18, the altcoin rose to a high of $10.41 before falling back. In prior price activity, the altcoin soared to highs of $9.58 and $11.85, then fell. Buyers have failed to lift the cryptocurrency price above the $12 barrier. The altcoin has been overbought at its recent highs. DOT prices are currently rising to the overbought sector of the market.
Technical indicators:
Key Resistance Levels: $10, $12, $14
Key Support Levels: $5, $3, $1
Polkadot Indicator Analysis
On November 23 and 24, there are two candlestick wicks pointing towards the $11 resistance zone. The candlestick wicks signal strong selling pressure at higher prices. The price bars are above the upward-sloping moving average lines. The altcoin will continue to rise because the price bars are above the moving average lines.
General Outlook for Polkadot (DOT)
Polkadot is in a sideways trend as it reaches an overbought area. Polkadot is now trading above the $8.00 support and below the $9.50 resistance level. Price movement has been constrained due to the presence of Doji candlesticks. The crypto signal is range-bound, with the altcoin pausing below its previous high.

Make money without lifting your fingers: Start using a world-class auto trading solution.
Note: Learn2.Trade is not a financial advisor. Do your research before investing your funds in any financial asset or presented product or event. We are not responsible for your investment.


