

Key Resistance Levels: $10, $12,$14
Key Support Levels: $5, $3,$1
Polkadot (DOT) Price Long-term Trend: Bearish
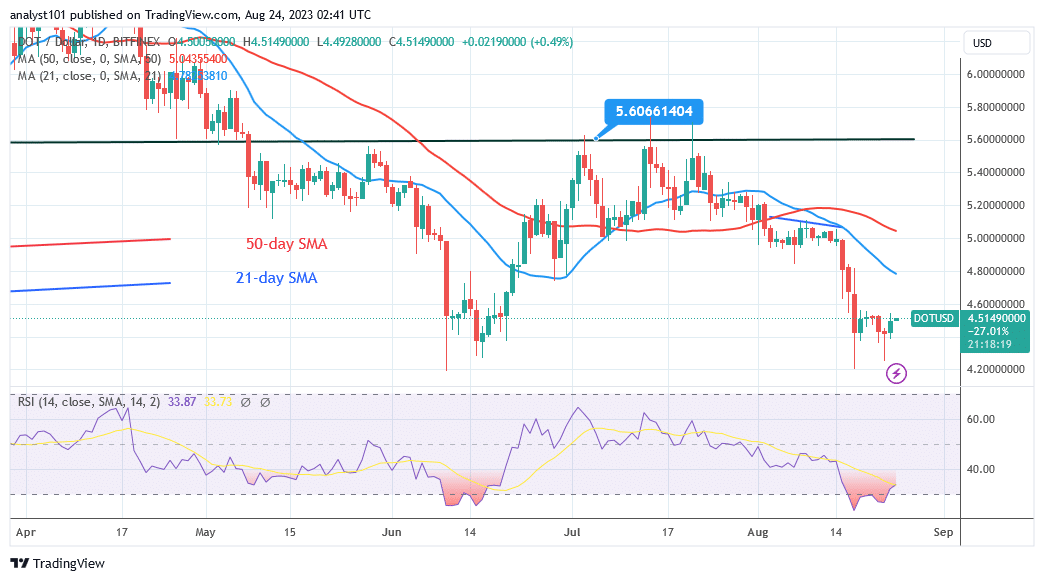
Polkadot (DOT) has resumed a sideways trend as it tries to advance above $4.50. The cryptocurrency has remained restricted to the chart’s bottom range. Since December 28, the current support level of $4.20 has held.
The price of the altcoin is now oscillating between $4.20 and $4.55. Polkadot, on the other hand, has reached the bottom of the chart. Furthermore, the market has reached an oversold level, and additional declines in the cryptocurrency are improbable.On the plus side, the rising trend is being tested at the $4.50 resistance level.
Polkadot will resume bullish momentum if it breaks above the moving average lines and breaks through the initial resistance.
Daily Chart Indicators Reading:
Polkadot is correcting upward as it reaches Relative Strength Index level 32 for period 14. The coin is in a bearish trend and could plummet. The crypto asset is rising over level 80 of the daily Stochastic. The coin will plummet and restart its price range constrained movement.
General Outlook for Polkadot (DOT)
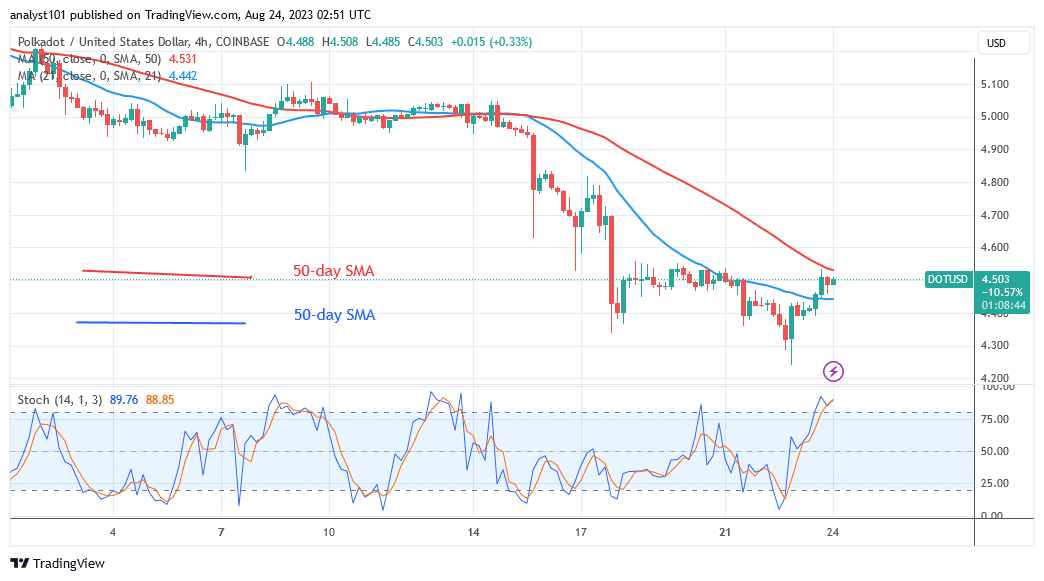
The cryptocurrency asset has been retesting the $4.50 resistance level as it tries to advance above $4.50. A break over the resistance level will signify the start of a new upswing. Meanwhile, if the Doji candlesticks persist, the altcoin will continue its sideways trend for a few days.
You can purchase crypto coins here. Buy LBLOCK
Note: Learn2.Trade is not a financial advisor. Do your research before investing your funds in any financial asset or presented product or event. We are not responsible for your investing


