
Lucky Block Price Forecast – Expert Analysis & Trading Tips | Learn 2 Trade – Expert Analysis & Trading Tips | Learn 2 Trade – October 3
The Lucky Block price forecast reveals that buyers are striving to regain control as the crypto price dips below the $0.00002270 key level.
LBLOCKUSD Long Term Trend: Bullish (1-Day Chart)
Key Levels
Support Levels: $0.00002100, $0.00002270
Resistance Levels: $0.00003000, $0.00003300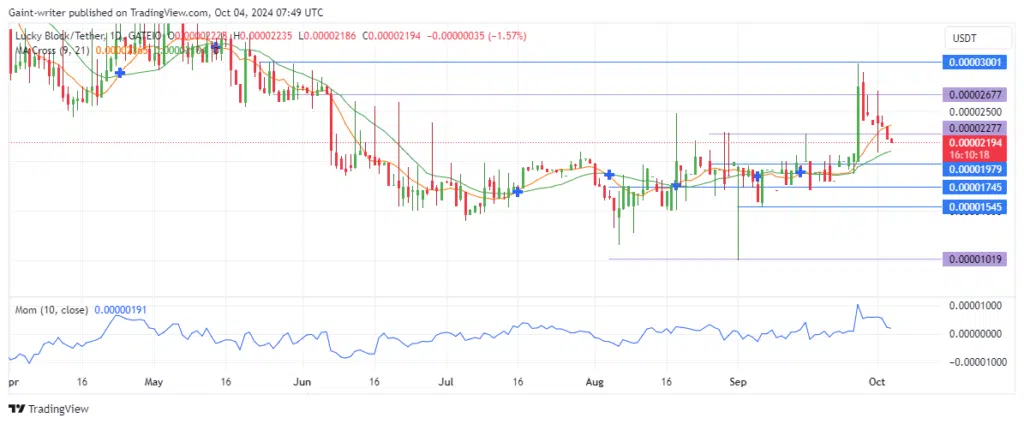
Lucky Block Price Forecast – Expert Analysis & Trading Tips | Learn 2 Trade – Expert Analysis & Trading Tips | Learn 2 Trade: LBLOCKUSD Outlook
Despite the current sell-off, bulls remain optimistic about a reversal. Buyers are targeting a potential new entry point near the middle of the Bollinger Band, which could serve as support and potentially prevent further selling. This level is seen as crucial for a market rebound.
The Momentum indicator reflects a decline due to the entrance of sellers, but buyers still hold hope for regaining control. A rebound at the middle of the Bollinger Band could provide buyers with the support necessary to intensify their efforts and attempt a reversal.
If momentum increases, it would present an ideal opportunity for buyers to strengthen their positions and drive the price back toward the $0.00003000 resistance level. The Bollinger Band indicates significant volatility, suggesting that the market conditions are still favorable for a potential resurgence, supported by crypto signals.
Lucky Block Medium Term Trend: Bullish (4-Hour Chart)
In the shorter time frame, sellers have shown dominance, pushing the price below $0.00002270. Nevertheless, bulls remain optimistic that the current selling pressure is temporary. While the Momentum indicator is currently weakened, it is expected to rise soon, signaling the possibility of a reversal.
How To Buy Lucky Block
Note: Learn2.trade is not a financial advisor. Do your research before investing your funds in any financial asset, product, or event. We are not responsible for your investment results.


