
Lucky Block Price Forecast – Expert Analysis & Trading Tips | Learn 2 Trade – Expert Analysis & Trading Tips | Learn 2 Trade – December 26th
The Lucky Block price forecast signals a potential bullish resurgence as the price gravitates toward the $0.00001390 market area.
Lucky Block Long-Term Trend: Bullish (Daily Chart)
Support Levels: $0.00001390, $0.00001250
Resistance Levels: $0.00001800, $0.00002410  Lucky Block buyers have consistently demonstrated resilience throughout the year, rebounding strongly from bearish cycles. After a recent climb to the significant $0.00002410 level, the market experienced a pullback, momentarily favoring sellers. However, this retracement appears to be setting the stage for buyers to regain momentum as the year draws to a close.
Lucky Block Price Forecast – Expert Analysis & Trading Tips | Learn 2 Trade – Expert Analysis & Trading Tips | Learn 2 Trade – LBLOCKUSD Outlook
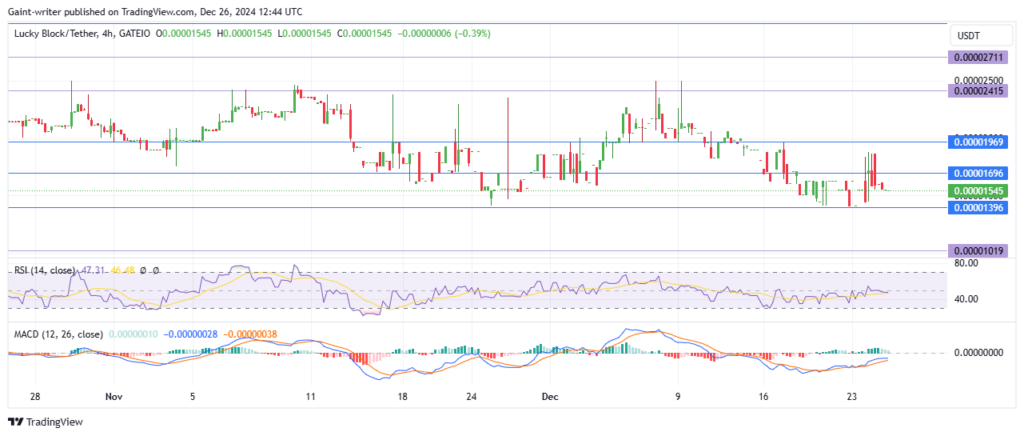
The RSI reflects diminishing selling pressure, with the signal line moving downward, suggesting a potential bullish reentry. Similarly, the MACD shows signs of recovery, aligning with growing buyer optimism despite the recent downward movement.
If buyers can defend the $0.00001390 support level, atoward the $0.00001800 resistance level. Breaking beyond this zone could lead to a retest of the $0.00002410 key level, further confirming a bullish trend.
Failure to sustain recovery efforts, however, might result in consolidation or a retest of lower support around $0.00001250. Traders should watch the MACD and RSI indicators closely for signals of a bullish reversal.
Lucky Block Medium-Term Trend: Bullish (4-Hour Chart)
On the 4-hour chart, buyers are steadily recovering from recent bearish moves. The MACD reveals waning selling momentum, while the RSI indicates a gradual shift in favor of buyers.  If buyers sustain their efforts, the price may rise toward $0.00001600 in the medium term, paving the way for further gains. Failure to maintain the $0.00001390 level, however, could result in a short-term dip before the recovery resumes. This setup, coupled with reliable crypto signals, points to a promising outlook for the Lucky Block market.
How To Buy Lucky Block
Note: Learn2.trade is not a financial advisor. Do your research before investing your funds in any financial asset, product, or event. We are not responsible for your investment results.


