
Lucky Block Price Forecast – Expert Analysis & Trading Tips | Learn 2 Trade – Expert Analysis & Trading Tips | Learn 2 Trade – July 16th
The Lucky Block price forecast indicates that buyers have maintained their strength and are determined to push the price beyond the $0.00001990 market zone despite ongoing consolidation.
LBLOCKUSD Long-Term Trend: Bullish (1-Day Chart)
Key Levels
Support Levels: $0.000026000, $0.000041200
Resistance Levels: $0.000019900, $0.000025300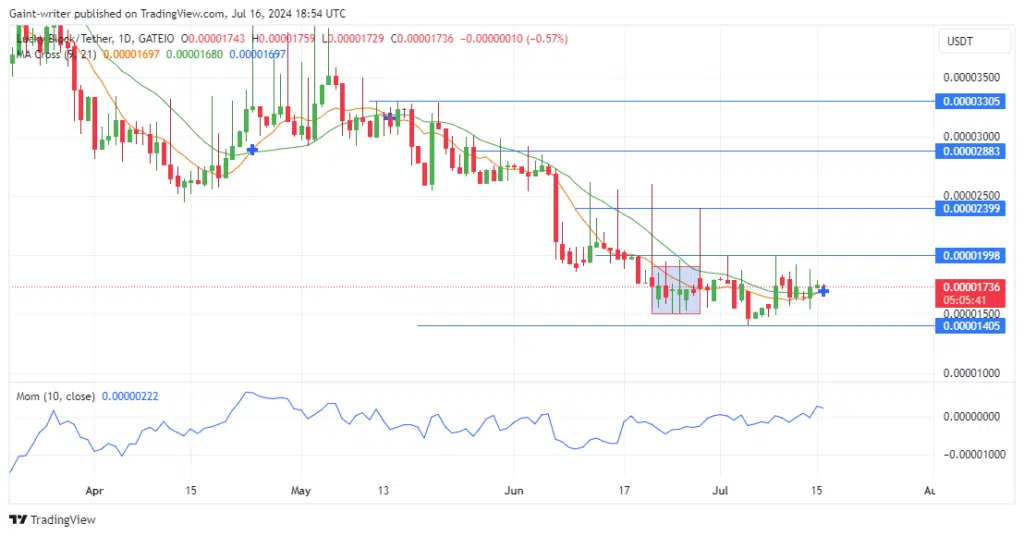
Lucky Block Price Forecast – Expert Analysis & Trading Tips | Learn 2 Trade – Expert Analysis & Trading Tips | Learn 2 Trade: LBLOCKUSD Outlook
Sell-side traders who previously pushed the price lower have slowed their momentum. In June, the market faced persistent bearish sentiment, with sellers breaking through the $0.00001990 price zone. However, buyers managed to stabilize market strength after recovering from the $0.00001400 key zone.
Recently, market strength has favored buyers, who are aggressively attempting to break out of the ranging market. The Momentum indicator has been rising as buyers advance, while the Moving Average crossing is still holding back, leaving the direction unclear.
Current market dynamics suggest that Lucky Block (LBLOCK) buyers have maintained their edge and are determined to push the price beyond the $0.00001990 key level. A successful breach of this resistance could pave the way for further upside momentum.
LBLOCKUSD Medium Term: Bullish (4-hour Chart)
How To Buy Lucky Block
Note: Learn2.trade is not a financial advisor. Do your research before investing your funds in any financial asset, product, or event. We are not responsible for your investment results.


