
Lucky Block Price Forecast – Expert Analysis & Trading Tips | Learn 2 Trade – Expert Analysis & Trading Tips | Learn 2 Trade – November 12th
The Lucky Block price forecast indicates that the market is showing signs of a potential comeback as buyers focus on the significant $0.00002410 resistance level.
LBLOCKUSD Long-Term Trend: Bullish (Daily Chart)
Support Levels: $0.00002150, $0.00002000
Resistance Levels: $0.00002410, $0.00002600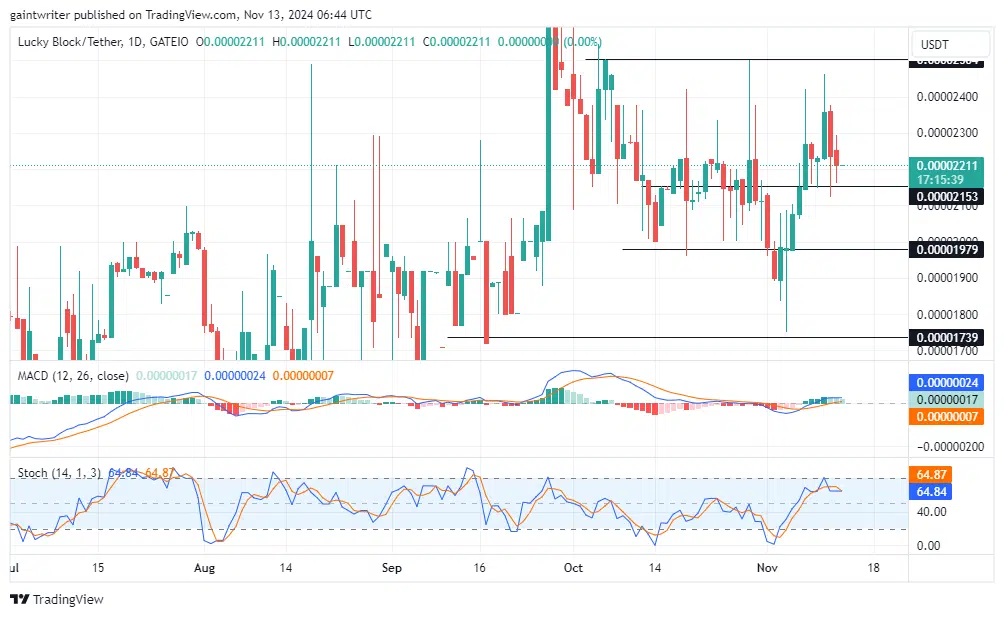
Lucky Block Price Forecast – Expert Analysis & Trading Tips | Learn 2 Trade – Expert Analysis & Trading Tips | Learn 2 Trade – LBLOCKUSD Outlook
The recent downturn in the market highlights a challenging zone for buyers, with the $0.00002400 level acting as a formidable resistance barrier. Despite this temporary setback, buyers remain optimistic, as shown by their ongoing efforts to stabilize the price around the $0.00002200 zone.
The Stochastic Oscillator on the daily chart suggests that although there has been a slight decline in its signal line, , hinting at a potential rebound if support holds at the current level.
The MACD (Moving Average Convergence Divergence) indicator remains positive, signaling that overall market sentiment is still in favor of the buyers. While the recent dip has introduced some short-term bearish pressure, the MACD’s position suggests that bullish momentum is not exhausted. The Stochastic Oscillator’s inclination toward the buy zone further supports the possibility of a recovery, even with minor fluctuations in its signal line.
Lucky Block Medium-Term Trend: Bullish (4-hour chart)
On the 4-hour chart, a clearer picture of the current struggle emerges as buyers prepare to apply renewed pressure for a comeback. The slight slip in price offers bulls an opportunity to regroup and make another push toward the $0.00002410 resistance level.
How To Buy Lucky Block
Note: Learn2.trade is not a financial advisor. Do your research before investing your funds in any financial asset, product, or event. We are not responsible for your investment results.


