

Lucky Block – Guide, Tips & Insights | Learn 2 Trade Market Prediction – Expert Analysis & Trading Tips | Learn 2 Trade: November 21
The Lucky Block – Guide, Tips & Insights | Learn 2 Trade market prediction is that the price of LBLOCKUSD will return to break the restriction zone at $0.0001670 after retesting close support at $0.0001500.
LBLOCK/USD Long-Term Trend: Bullish (4-hour Chart)
Key Levels:
Zones of supply: $0.0001670, $0.0001750, $0.0001880
Zones of Demand: $0.0001570, $0.0001500, $0.0001410
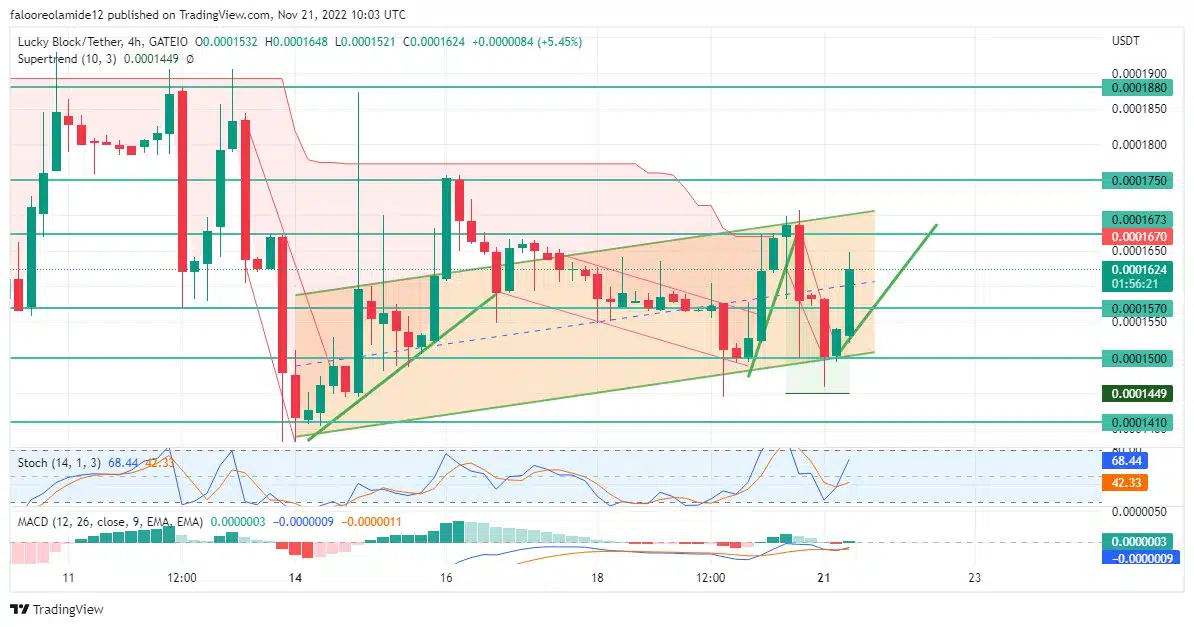
LBLOCK/USD maintains its course within the bullish channel. The channel has marked the rise in the price of the coin from the support level of $0.0001410 to the supply level of $0.0001670 within a week.
Lucky Block – Guide, Tips & Insights | Learn 2 Trade Market Prediction – Expert Analysis & Trading Tips | Learn 2 Trade: LBLOCK/USD Anticipation
Since the 14th of the month, the LBLOCK/USD has been moving in a repeated up-and-down pattern within the bullish range. At a point on the 16th, the price of the coin broke out of the channel to reach a higher high of $0.0001750, only for a sharp decline to set in moments later.
This decline brought the price back to the demand level point at $0.001500, from where the price reversed, resuming another bullish phase. In the same manner, they returned to retest at the same level again after reaching a peak.
However, it was from this point that the market began the strong bullish run that the Supertrend indicator caught sight of. In the wake of the new hyped-up bullish activities, the indicator turned green, showing a strong bullish market.
LBLOCK/USD Medium-Term Trend: Bullish (1-hour chart)
The Stochastic Oscillator indicates a bullish market, as the indicator lines have significantly crossed over the midline. With this, the coin bulls aim to push the price to the level of $0.0001670.

The price action is expected to follow the trendline as it seeks to break into higher territories. The MACD indicator shows a slightly oversold market, and this only further confirms the current reversal. The market is ongoing and stable.
How To Buy Lucky Block – Guide, Tips & Insights | Learn 2 Trade
Note: Learn2.trade is not a financial advisor. Do your research before investing your funds in any financial asset or presented product or event. We are not responsible for your investing results.
- Broker
- Min Deposit
- Score
- Visit Broker

- Award-winning Cryptocurrency trading platform
- $100 minimum deposit,
- FCA & Cysec regulated

- 20% welcome bonus of upto $10,000
- Minimum deposit $100
- Verify your account before the bonus is credited


- Fund Moneta Markets account with a minimum of $250
- Opt in using the form to claim your 50% deposit bonus


