

Lucky Block – Guide, Tips & Insights | Learn 2 Trade Price Prediction – January 26
The Lucky Block – Guide, Tips & Insights | Learn 2 Trade price prediction is for the market to bide its time for the right moment when the bulls will strike to shake off bearish pressure for a price surge.
LBLOCK/USD Long-Term Trend: Bullish (1-Day Chart)
Key Levels:
Zones of supply: $0002980, $0.0002460, $0.0002040
Zones of Demand: $0.0001570, $0.0001360, $0.0001250
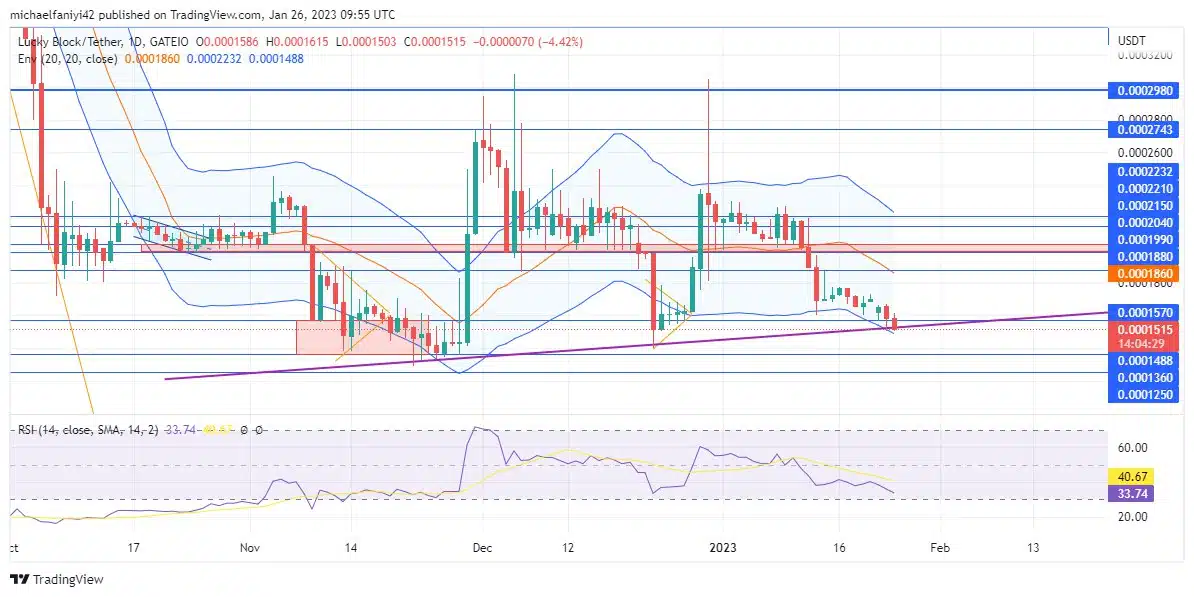
The Lucky Block – Guide, Tips & Insights | Learn 2 Trade market remains on the verge of a bullish upsurge as the market is structured for bullish expressions. Pressure from the sellers has stalled the immediate price rise, but it is only a matter of time before the buyers shake off the bearish pressure to continue the tapering movement of the market.
Lucky Block – Guide, Tips & Insights | Learn 2 Trade Market Prediction – Expert Analysis & Trading Tips | Learn 2 Trade: LBLOCK/USD Anticipation
The Lucky Block – Guide, Tips & Insights | Learn 2 Trade market is always structured for an eventual bullish breakout. Although the bears are putting pressure on the market, this is the case. However, it is only a matter of time before the coin resumes its bullishness.
Currently, Lucky Block – Guide, Tips & Insights | Learn 2 Trade is hugging tightly to the rising trendline due to pressure from the bears. However, the price made it through in previous instances of this occurrence and will make it through again.
The lower line of the Envelope indicator has cupped the daily candlesticks to both acts as a cushion and to aid the price rise later on. Compared with previous instances, this is even more positive for the buyers.
LBLOCK/USD Medium-Term Trend: Bullish (4-hour chart)
The RSI (Relative Strength Index) line on the daily chart has dropped below the middle line but has also stopped short of plunging into the oversold region and is instead hovering just above the borderline. On the 4-hour chart, too, the RSI line is fluctuating above the borderline of the oversold region.

The candlesticks have risen to the middle line for the Envelope indicator. This is a pointer to the progress that the market is making on the 4-hour chart. As in previous times, the coin is expected to take off shortly from the rising trendline and continue its tapering movement till it finally breaks out.
How To Buy Lucky Block – Guide, Tips & Insights | Learn 2 Trade
Note: Learn2.trade is not a financial advisor. Do your research before investing your funds in any financial asset or presented product or event. We are not responsible for your investing results.
- Broker
- Min Deposit
- Score
- Visit Broker

- Award-winning Cryptocurrency trading platform
- $100 minimum deposit,
- FCA & Cysec regulated

- 20% welcome bonus of upto $10,000
- Minimum deposit $100
- Verify your account before the bonus is credited


- Fund Moneta Markets account with a minimum of $250
- Opt in using the form to claim your 50% deposit bonus


