

Lucky Block Market Expectation – September 20
The Lucky Block market expectation is for a breakout from below its descending trendline. The market is now in the final stages before the buyers take the bulls by the horns.
LBLOCK/USD Long-Term Trend: Bullish (4-hours Chart)
Key Levels:
Zones of Supply: $0.0008360, $0.0006820
Zones of Demand: $0.0001878, $0.0005350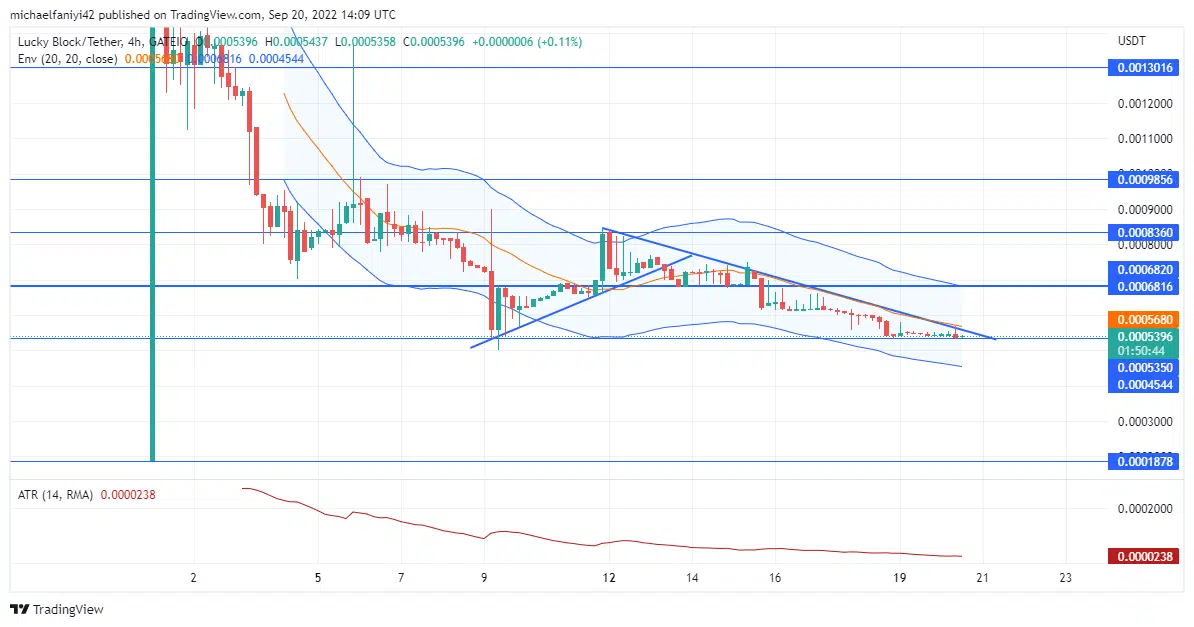
Lucky Block Price Forecast – Expert Analysis & Trading Tips | Learn 2 Trade – Expert Analysis & Trading Tips | Learn 2 Trade: LBLOCK/USD Outlook
An inability of the Lucky Block market to immediately violate the $0.0008360 resistance level has forced the price to take a different route in achieving the same goal, albeit a very effective one.
Gradually, the market has adjusted to a descending trendline, which takes it all the way back down to the $0.0005350 level where it started from. The strong support level is expected to give the price a strong push.
The ATR (Average True Range) indicator shows the market is now at an all-time low volatility level. This is in preparation for a surge in the same volatility as the price tries to breakout.
LBLOCK/USD Medium-Term Trend: Bullish (1-hour chart)
The 1-hour chart shows that the market has dropped to the $0.0005350 demand level and has aligned itself in a sideways direction in obedience to the price level. A trigger from the support is all that is now needed for the market to dash through the trendline and begin an aggressive campaign.
How To Buy Lucky Block
Note: Learn2.trade is not a financial advisor. Do your research before investing your funds in any financial asset or presented product or event. We are not responsible for your investing results.


