

Market Analysis – July 11
FTSE 100 initiated a strong bullish trend at the beginning of Q2. In April, the price rallied from the demand level at 7537.0 after a sharp decline that targeted deep liquidity zones around 8111.0 and 7537.0. This downward movement acted as a liquidity grab, triggering a powerful surge that led the market to surpass the previous all-time high of 8913.0.
FTSE Key Levels
Demand Levels: 8702.0, 8111.0, 7537.0
Supply Levels: 8913.0, 9500.0, 10000.0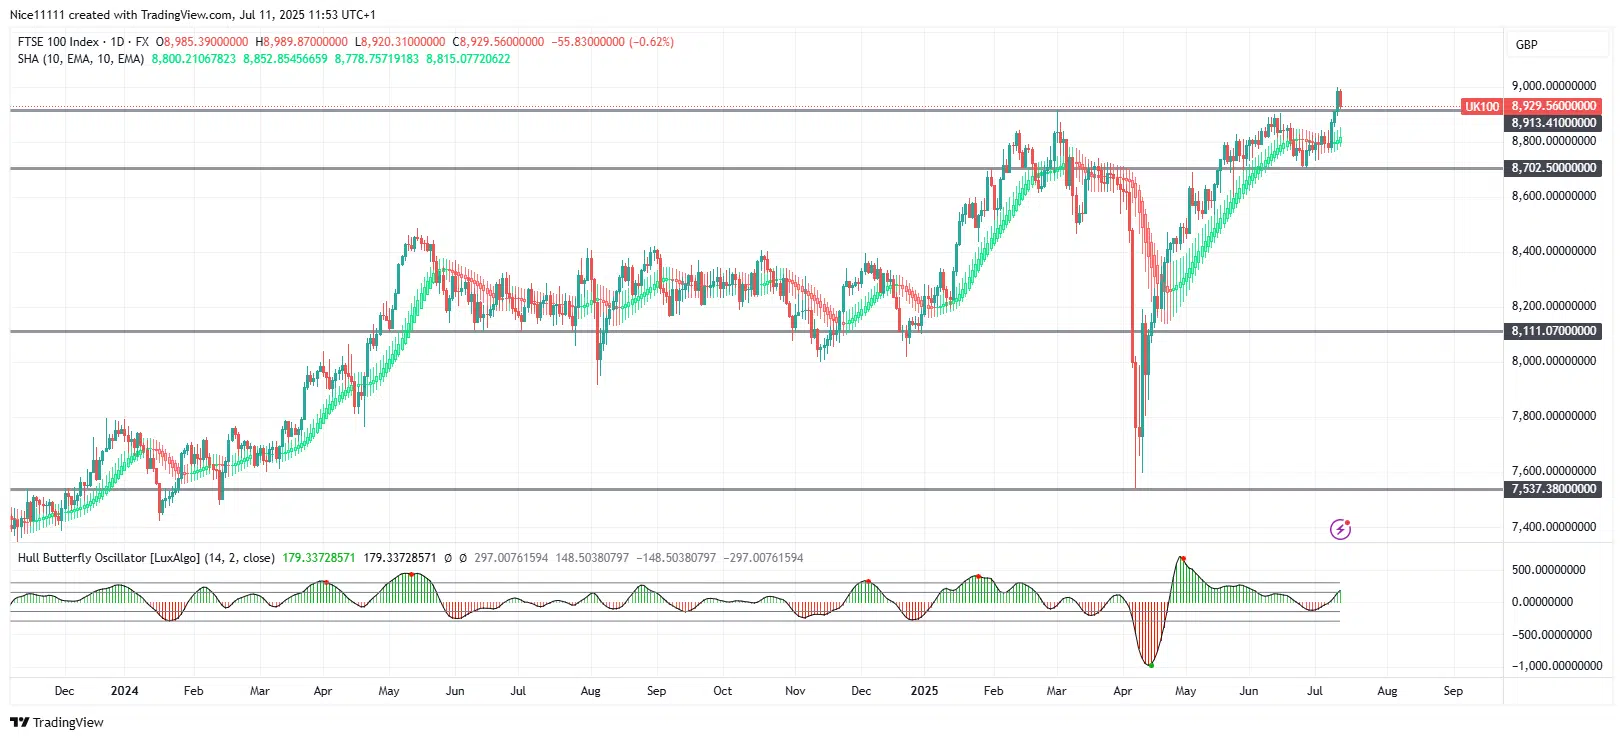
FTSE Long-Term Trend: Bullish
The Hull Butterfly Oscillator showed that the market was oversold at 7537.0 during the crash, signaling a key buying opportunity. This was followed by a strong bullish reversal, characterized by a consistent series of higher highs and higher lows as the price climbed toward the previous all-time high of 8913.0.
After touching 8913.0, bullish momentum briefly faded, leading to a swing high and a moderate pullback. However, the market regained support at 8702.0—another key demand level—where buyers stepped back in with strong conviction. This renewed momentum drove the price to a new all-time high of 9000.0, providing a key reference point for forex signals traders watching for further bullish continuation.
FTSE Long-Term Trend: Bullish
Make money without lifting your fingers: Start using a world-class auto trading solution
How To Buy Lucky Block
Note: Learn2.trade is not a financial advisor. Do your research before investing your funds in any financial asset, product, or event. We are not responsible for your investment results.


