
Ethereum (ETH) Current Statistics
The current price: $3,229.60
Market Capitalization: $388.54B
Trading Volume: $19.76B
Major supply zones: $3,500, $4,000, $4,500
Major demand zones: $2,500, $2,000, $1,500
Ethereum (ETH) Price Analysis July 26, 2024
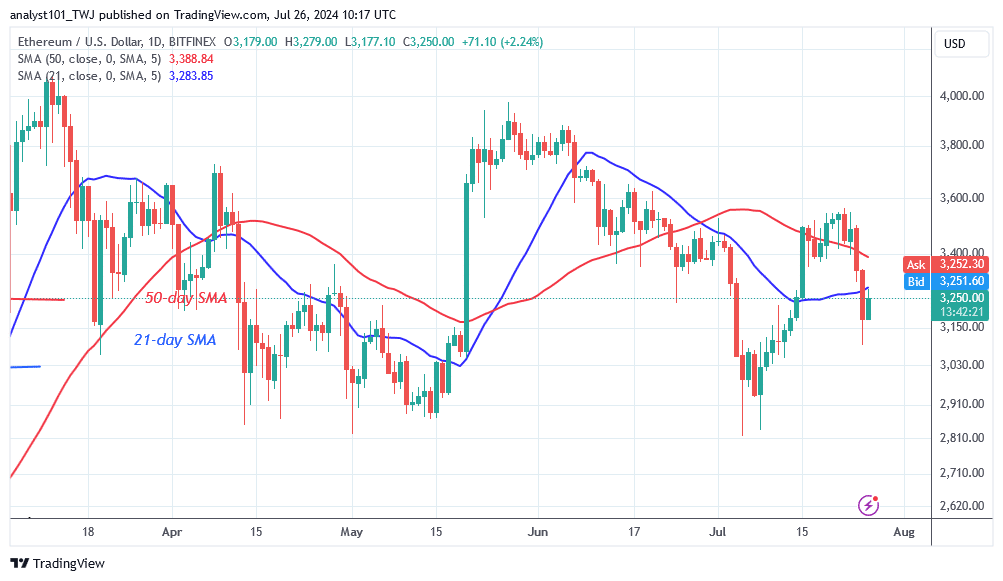
Ethereum’s (ETH) price falls below the moving average lines as bearish momentum hits a low of $3,093. The bearish momentum hit a low of $3,093, but bulls bought the dips. In prior price activity, Ether surged to a high of $3,551 but was stuck at the $3,600 resistance zone for a week.
Buyers fail to sustain the price above the $3,600 resistance mark, leading to the cryptocurrency’s drop. Today, bearish momentum has paused above $3,100 support, allowing the altcoin to resume its upward trend. The largest altcoin trades above the $3,100 support level but below the moving average lines.
ETH Technical Indicators Reading
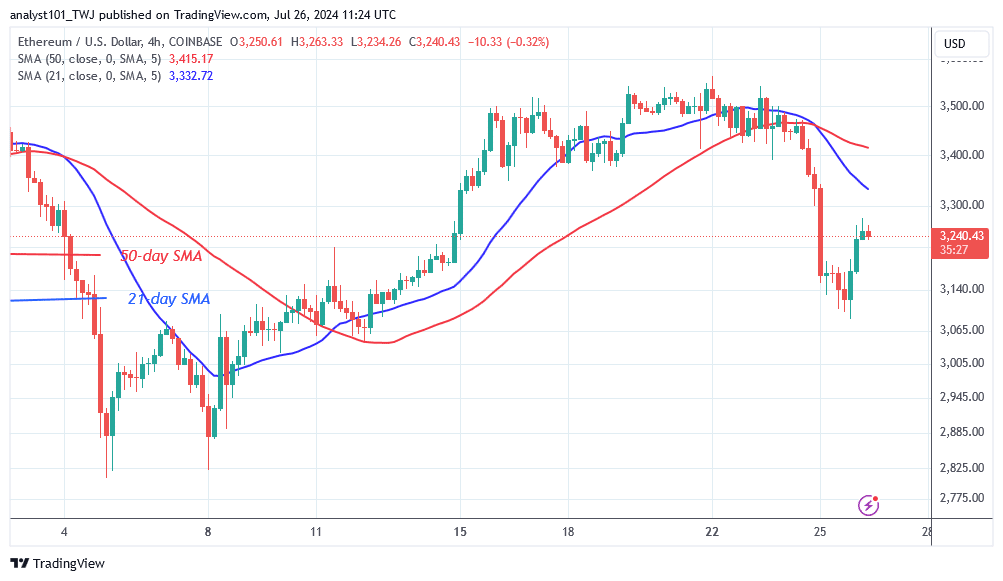
On July 25, the bearish trend broke below the moving average lines and reached a low of $3,093. The altcoin may fall further as the price bars are below the moving average lines. Ether’s 4-hour chart shows a bearish crossover, signaling a negative indicator.
Conclusion
Ether faces rejection at the $3,600 resistance level as bearish momentum hits a low of $3,093. The altcoin’s 4-hour chart shows a range-bound move between $3,065 and $3,300. If the altcoin is rejected at its recent high, it will be forced to trade in a range. In the meantime, the crypto signal is bearish because the price is in the bearish trend zone.
Make money without lifting your fingers: Start using a world-class auto trading solution.
Note: Learn2.Trade is not a financial advisor. Do your research before investing your funds in any financial asset or presented product or event. We are not responsible for your


